Technical Analysis
Triangles: Compression Before Resolution
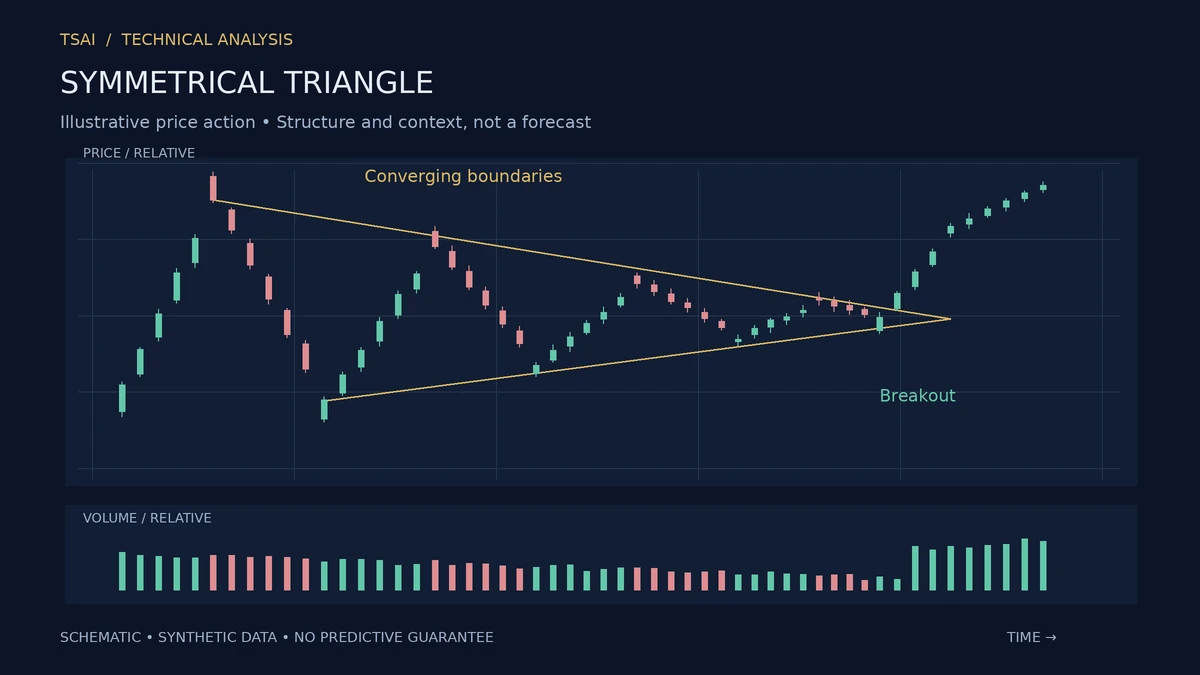
A triangle is a chart pattern in which price oscillates between two converging lines. The upper line is a resistance level; the lower line is a support level; the two lines converge as the pattern develops. The result is a contraction of the price range, and the contraction is the point. Triangles describe compression, and compression precedes resolution.
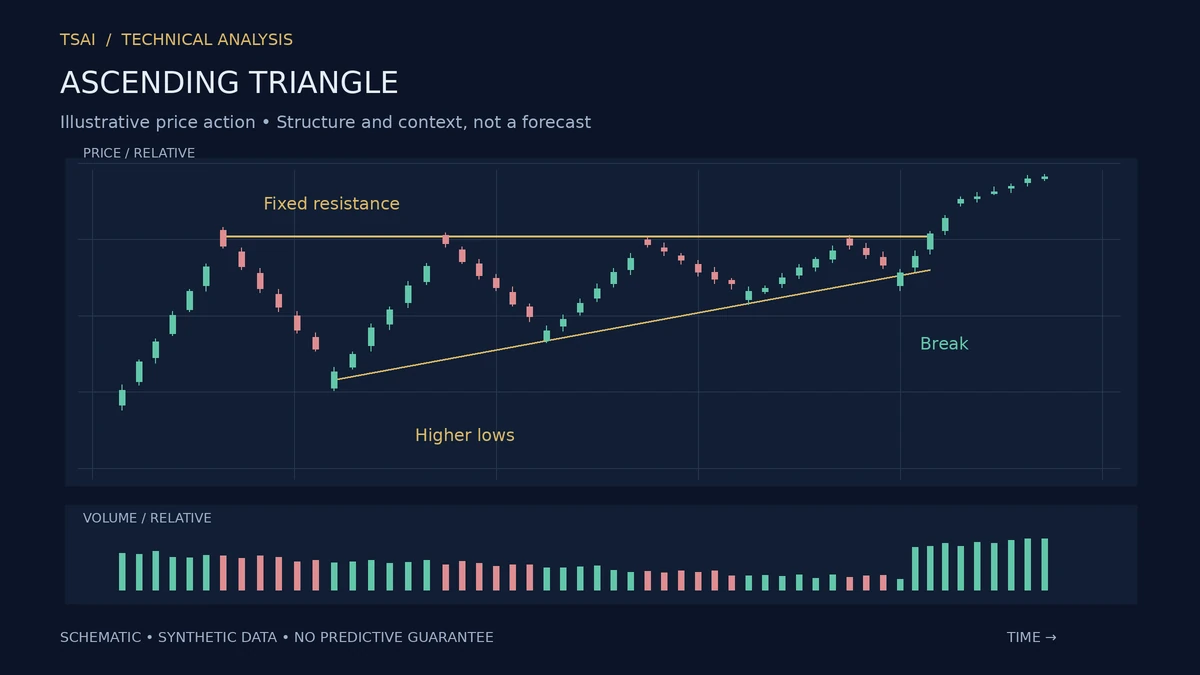
The three common forms are ascending, descending, and symmetrical. An ascending triangle has a flat upper line and a rising lower line. A descending triangle has a flat lower line and a falling upper line. A symmetrical triangle has both lines converging toward the middle. The forms differ in the slope of the lines, and the slopes carry information about the balance of buyers and sellers during the compression.
What Each Form Describes
An ascending triangle describes buyers stepping in at progressively higher levels while sellers defend a fixed price. The pattern is often read as bullish, because the buyers are the more aggressive side. The reading is a tendency, not a law.
A descending triangle describes sellers offering at progressively lower levels while buyers defend a fixed price. The pattern is often read as bearish, for the mirror-image reason. A symmetrical triangle describes neither side in control; the pattern is directionally neutral, and the resolution can go either way.
The Resolution Is Not Guaranteed
The most important thing to understand about triangles is that the direction of resolution is not determined by the pattern. An ascending triangle usually resolves upward, but it can resolve downward. A symmetrical triangle can resolve in either direction. The pattern describes the compression; the direction of the breakout is a separate question.
This is why triangles are best used as setups rather than as signals. The pattern identifies a period of compression and a likely timing for resolution. The direction of the trade should be determined by the direction of the break, confirmed by volume and by the broader trend.
Volume and the Breakout
The volume signature of a triangle is a decline during the pattern and an increase on the breakout. The declining volume is consistent with the compression: as the range narrows, fewer participants find the price attractive. The volume expansion on the break is the confirmation that the resolution is genuine.
A breakout on low volume is suspect. The pattern can break, retrace, and resume the compression, which is a false breakout. The volume signature is not a requirement, but its presence strengthens the read.
The Apex and the Timing
The apex of the triangle is where the two lines would meet. The pattern typically resolves before the apex, and the timing of the resolution is one of the pattern's useful features. A triangle that resolves late—close to the apex—is often more explosive, because the compression has been more complete.
The apex is not a prediction of the timing. It is a reference point that describes the geometry of the pattern. The actual resolution can come earlier or later, and the timing is not a signal in itself.
What Triangles Do Not Do
They do not predict the direction of the resolution. They do not work because of any geometric law. They describe a compression of the price range and make the boundaries of that compression visible. Used as a setup for breakouts, they are one of the more useful classical patterns. Used as a directional prediction, they will mislead as often as they inform.
Risk Disclosure: The above content is a discussion of technical analysis methods only and does not constitute any investment advice. Chart patterns carry no predictive guarantee; no single pattern should be the sole basis for trading decisions. Markets carry risk; decisions must be independent.