Technical Analysis
Wedges: Rising and Falling, and What They Mean
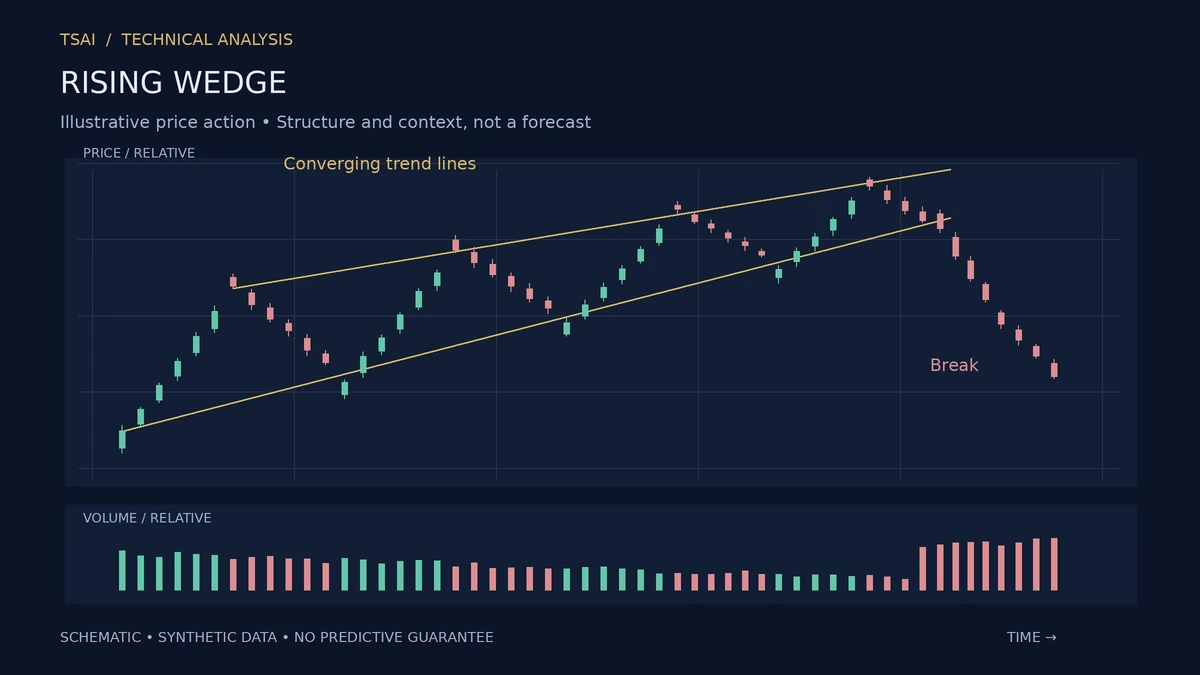
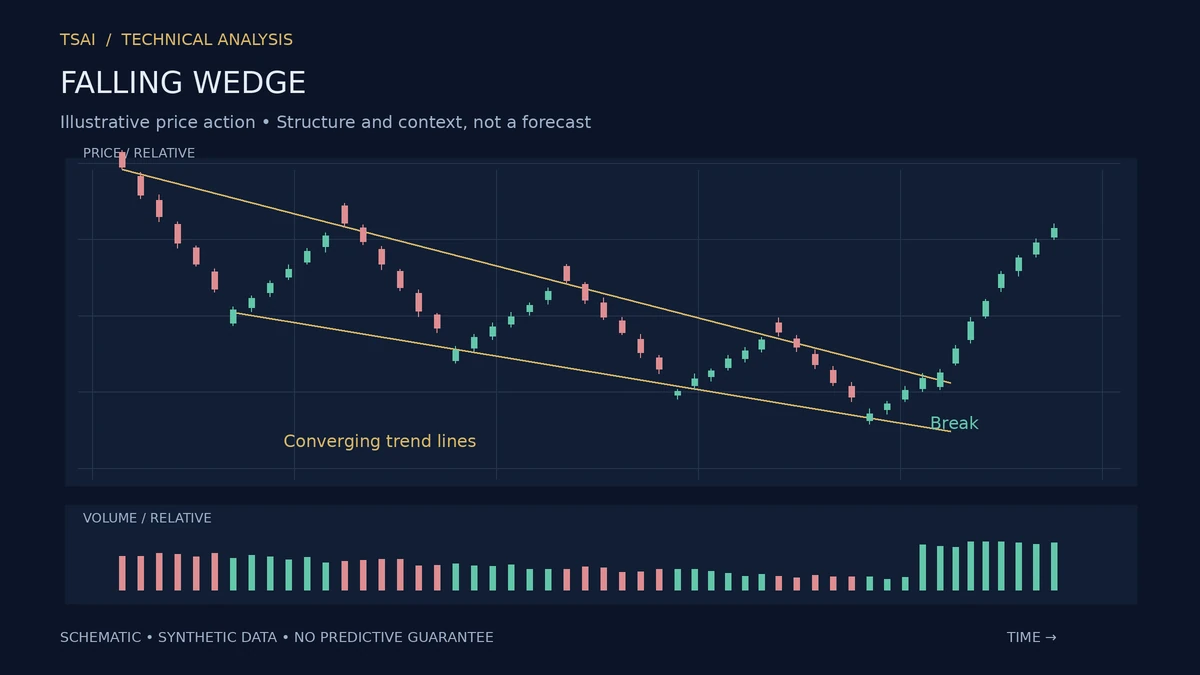
A wedge is a chart pattern in which price oscillates between two converging lines that both slope in the same direction. A rising wedge has both lines sloping upward, with the lower line rising faster than the upper. A falling wedge has both lines sloping downward, with the upper line falling faster than the lower. The convergence is the key feature, as with triangles, but the common slope distinguishes wedges from triangles.
The most discussed feature of wedges is the counterintuitive directional expectation. A rising wedge is often read as bearish, and a falling wedge as bullish. The reading is not arbitrary; it is based on the deceleration that the pattern describes.
Why a Rising Wedge Is Often Bearish
A rising wedge describes a rally that is losing momentum. The price is still rising, but the rate of rise is decreasing, as the two lines converge. The buyers are still in control, but their control is weakening. The pattern is a description of deceleration, and deceleration often precedes reversal.
The reading is a tendency, not a law. A rising wedge can resolve upward, particularly in a strong trend. The pattern describes the deceleration; the resolution depends on whether the deceleration turns into a reversal or a pause.
Why a Falling Wedge Is Often Bullish
A falling wedge describes a decline that is losing momentum. The price is still falling, but the rate of decline is decreasing. The sellers are still in control, but their control is weakening. The pattern is a description of deceleration, and deceleration often precedes reversal.
The same caveat applies: the reading is a tendency, not a law. A falling wedge can resolve downward, particularly in a strong downtrend.
The Breakout and the Target
The breakout from a wedge is typically in the direction opposite to the slope. A rising wedge breaks downward; a falling wedge breaks upward. The breakout is the confirmation of the pattern's directional expectation.
The conventional target is the height of the wedge at its widest point, projected from the breakout. The target is a convention, not a prediction.
Volume and the Wedge
The volume signature of a wedge is a decline during the pattern and an increase on the breakout. The declining volume is consistent with the deceleration: as the rate of change slows, fewer participants find the price attractive. The volume expansion on the break is the confirmation.
What Wedges Do Not Do
They do not predict the direction of the resolution with certainty. They do not work because of any geometric law. They describe a deceleration of the trend and make the converging boundaries visible. Used as a description of weakening momentum, they are useful. Used as a mechanical reversal signal, they will produce false signals in strong trends.
Risk Disclosure: The above content is a discussion of technical analysis methods only and does not constitute any investment advice. Chart patterns carry no predictive guarantee; no single pattern should be the sole basis for trading decisions. Markets carry risk; decisions must be independent.