Technical Analysis
Cup and Handle: A Rounding Base and a Small Pullback
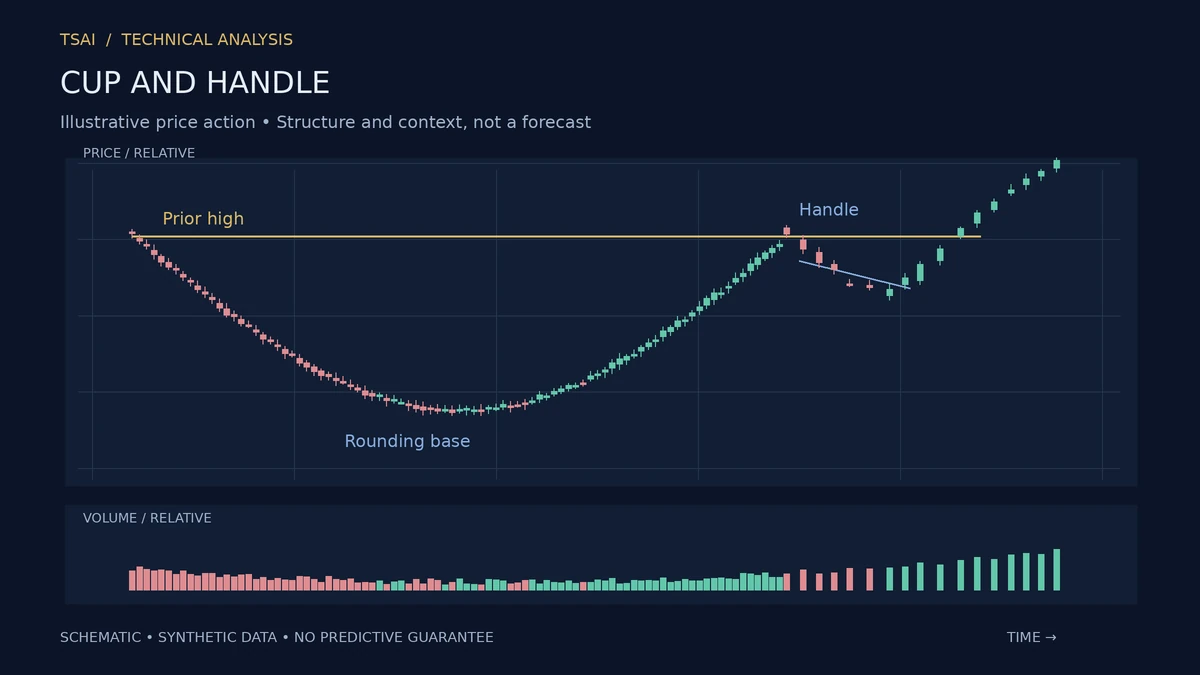
The cup and handle is a bullish continuation pattern named for its shape. The "cup" is a rounding base—a U-shaped decline and recovery that takes price back to roughly the level of the prior high. The "handle" is a small pullback that forms after the cup is complete, typically a shallow, short consolidation. The pattern is completed when price breaks above the handle.
The pattern was popularized by William O'Neil, and it is widely used in growth-stock investing. The shape is intuitive: a rounding base describes a transition from selling to buying, and the handle describes a final shakeout before the breakout.
The Rounding Base
The cup is a rounding base, not a V-shaped bottom. The distinction matters. A V-shaped bottom is a sharp reversal, often driven by a single event. A rounding base is a gradual transition, driven by a change in the balance of buyers and sellers over time. The gradual transition is more consistent with a durable bottom.
The depth and duration of the cup are not fixed, but the pattern is more reliable when the cup is deep enough to represent a meaningful decline and long enough to represent a genuine transition. A shallow, short cup is more likely to be a consolidation than a base.
The Handle
The handle is a small pullback that forms after the cup is complete. It is typically shallow—a fraction of the cup's depth—and short. The handle is a shakeout: it tests whether the buyers who drove the recovery are still present.
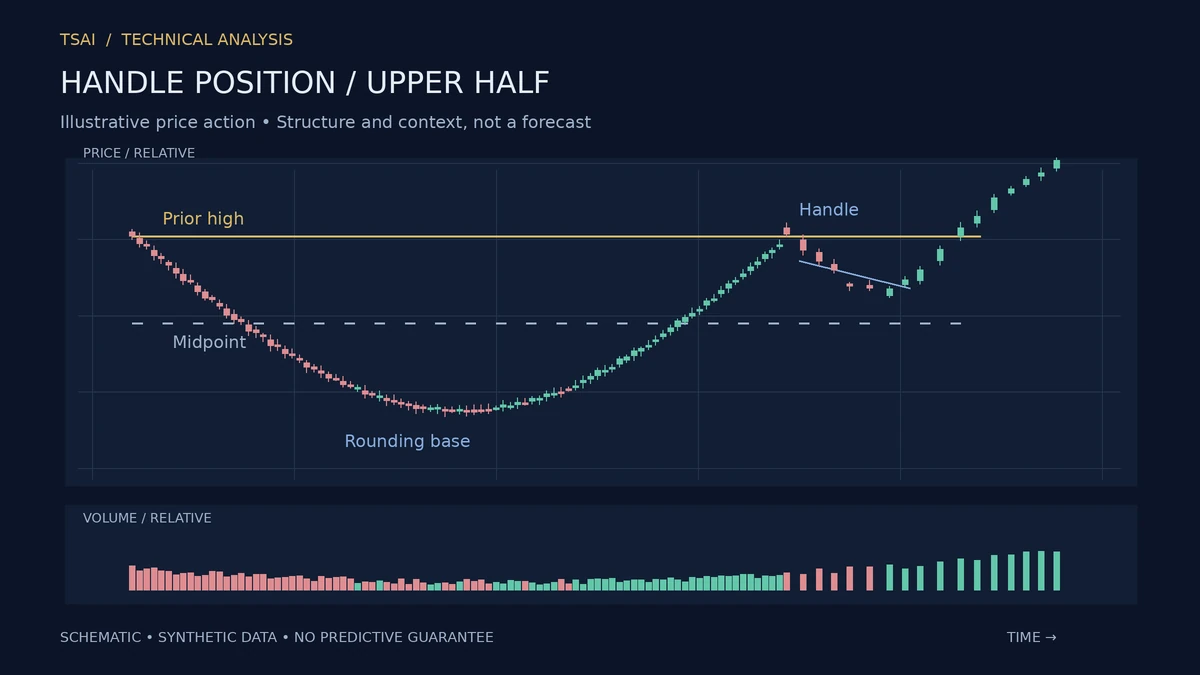
The handle should form in the upper half of the cup, ideally near the prior high. A handle that forms in the lower half is a sign that the recovery is not complete. The position of the handle is one of the pattern's quality criteria.
The Breakout
The pattern is completed when price breaks above the handle's high. The breakout is the confirmation, and it is often accompanied by an increase in volume. The volume expansion is the signature of genuine participation.
The conventional target is the depth of the cup, projected from the breakout point. The target is a convention, not a prediction.
The Failure Mode
The most common failure mode is a breakout that fails and reverses. The pattern is a continuation pattern by expectation, not by guarantee. A failure is informative: the market had a chance to break out and did not.
What the Pattern Does Not Do
It does not predict the size or timing of the continuation. It does not work because of any geometric law. It describes a rounding base and a small pullback, and it makes the structure visible. Used as a setup for a bullish continuation, it is one of the more reliable classical patterns. Used as a guarantee, it will fail often enough to be costly.
Risk Disclosure: The above content is a discussion of technical analysis methods only and does not constitute any investment advice. Chart patterns carry no predictive guarantee; no single pattern should be the sole basis for trading decisions. Markets carry risk; decisions must be independent.