Technical Analysis
Flags and Pennants: Pauses in a Trend
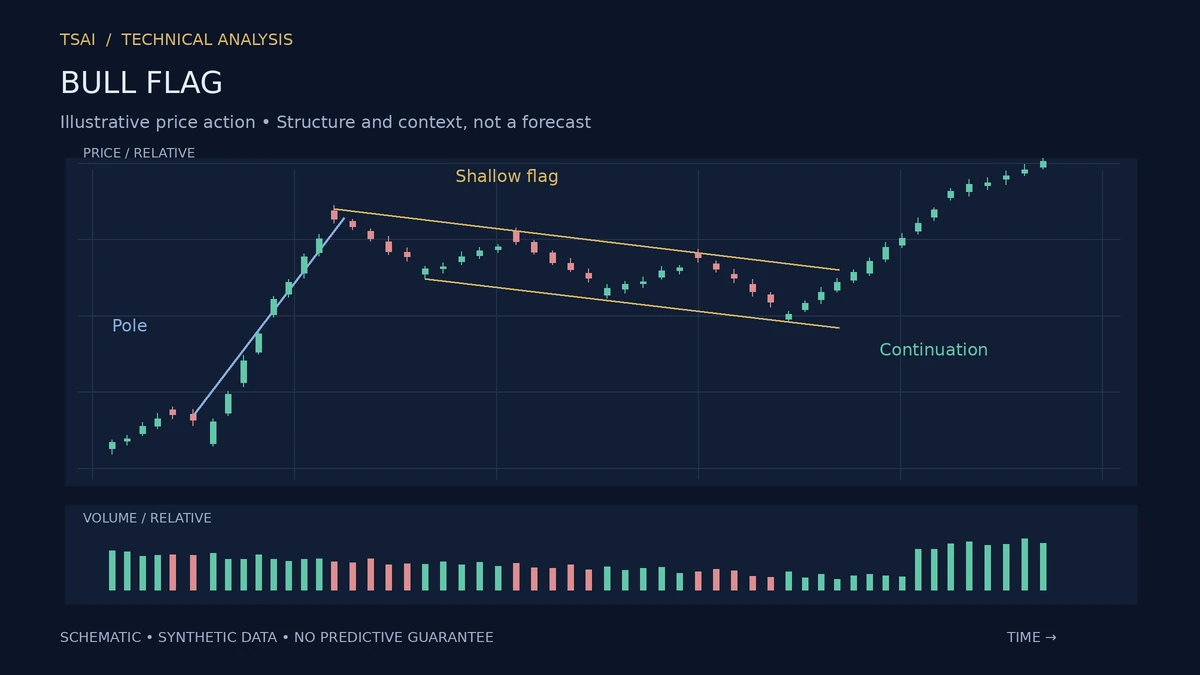
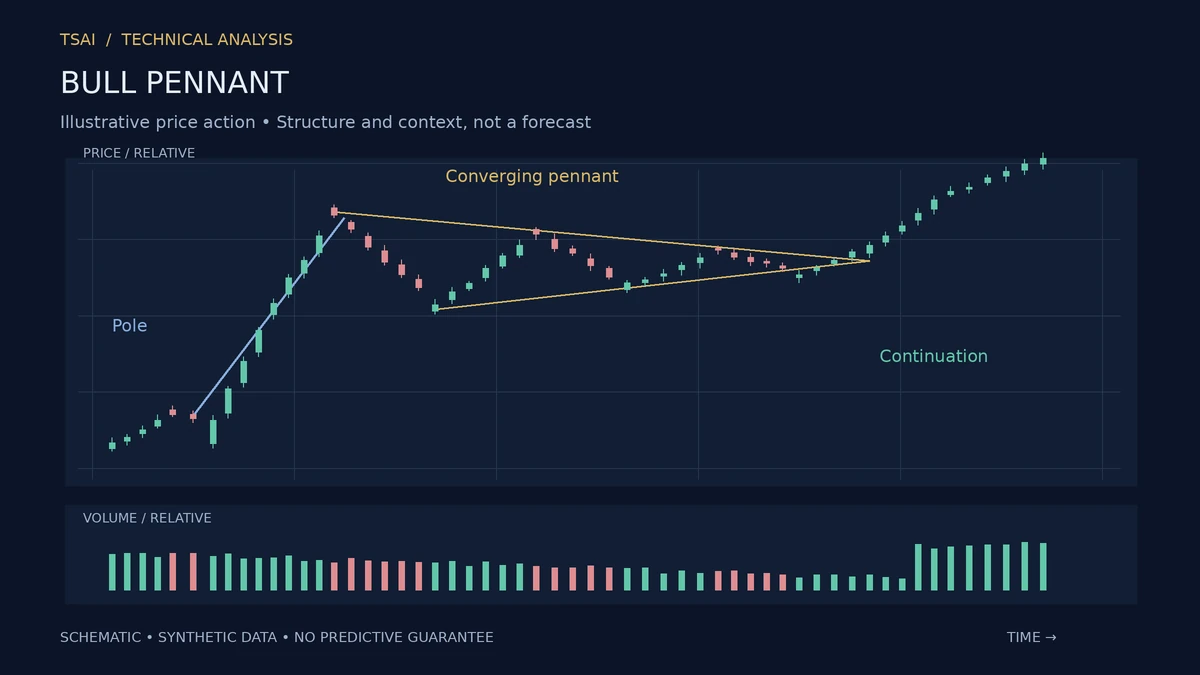
Flags and pennants are short consolidation patterns that form after a sharp price move. They are continuation patterns, meaning they are expected to resolve in the direction of the prior move. The distinction between the two is the shape of the consolidation: a flag is a small rectangle or parallelogram, typically sloping against the trend; a pennant is a small triangle, with converging lines.
Both patterns share the same logic. A sharp move attracts attention and creates a temporary imbalance. The consolidation is a pause, during which the market absorbs the move and prepares for the next leg. The pause is the setup; the continuation is the resolution.
Why They Are Continuation Patterns
The continuation expectation is not arbitrary. A sharp move that is followed by a shallow, short consolidation is a market that has not exhausted its momentum. The consolidation is a rest, not a reversal. The pattern is a description of that rest.
The distinction from reversal patterns is the depth and duration of the consolidation. A flag or pennant is shallow and short; a reversal pattern is deeper and longer. The shallow, short consolidation is the signature of a pause, not a change in trend.
The Measurement
The conventional target for a flag or pennant is the height of the prior move (the "flagpole"), projected from the breakout point. The target is a convention, not a prediction. It provides a reference for where the pattern's logic would suggest price might go, based on the assumption that the momentum of the prior move is likely to repeat.
The target should be treated as a hypothesis. Many flags and pennants reach their targets; many do not. The target is useful as a planning tool and as a way to assess whether the move is behaving as the pattern would suggest.
Volume and the Pattern
The volume signature of a flag or pennant is a decline during the consolidation and an increase on the breakout. The declining volume is consistent with the pause: as the market absorbs the move, fewer participants find the price attractive. The volume expansion on the break is the confirmation that the continuation is genuine.
The volume signature is not a requirement, but its presence strengthens the read. A breakout on low volume is suspect.
The Failure Mode
The most common failure mode for flags and pennants is a breakout that fails and reverses. The pattern is a continuation pattern by expectation, not by guarantee. When the breakout fails, the failure is informative: the market had a chance to continue and did not. The failure is often a more significant signal than the original pattern.
What Flags and Pennants Do Not Do
They do not predict the size or timing of the continuation. They do not work because of any geometric law. They describe a pause in a trend and make the boundaries of the pause visible. Used as a setup for continuation, they are one of the more reliable classical patterns. Used as a guarantee of continuation, they will fail often enough to be costly.
Risk Disclosure: The above content is a discussion of technical analysis methods only and does not constitute any investment advice. Chart patterns carry no predictive guarantee; no single pattern should be the sole basis for trading decisions. Markets carry risk; decisions must be independent.