RSI: The Relative Strength Index
A powerful tool for understanding market momentum, spotting potential opportunities, and interpreting the strength behind price movements.
Introduction: Measuring the Strength Behind Price Movements
In stock trading, understanding where a price is moving is important. But understanding how strongly it is moving can be just as valuable. A stock may be rising rapidly, losing momentum, or recovering after a period of heavy selling. Recognizing these changes can help traders make more informed decisions.
The Relative Strength Index (RSI) is one of the most widely used indicators for analyzing market momentum. Developed by J. Welles Wilder Jr. and introduced in his 1978 book New Concepts in Technical Trading Systems, RSI provides a numerical measurement of the strength of recent upward and downward price movements.
The indicator moves between 0 and 100, making it relatively easy to interpret. Its popularity comes from its ability to identify potentially important changes in momentum, highlight overbought and oversold conditions, and reveal situations in which price movements and underlying momentum begin to disagree.
However, RSI is not a crystal ball. Its real value lies in understanding what it measures, the conditions in which its signals become meaningful, and how it can be combined with other elements of technical analysis.
How RSI Works
The RSI calculation compares the average size of recent price gains with the average size of recent price losses over a selected number of periods.
The standard setting is 14 periods. On a daily chart, this generally means the indicator evaluates recent daily price changes. On an hourly chart, it evaluates hourly changes instead.
The calculation begins by separating upward price movements from downward price movements. These are then averaged using Wilder's smoothing method, which gives recent price changes an influence while retaining information from earlier movements.
RS = Average Gain / Average Loss
When upward movements are substantially larger than downward movements, RSI rises. When downward movements dominate, RSI falls.
An RSI reading of 75, for example, does not mean that a stock has risen by 75%. It indicates that the balance of recent gains and losses has become strongly positive.
Understanding the 70 and 30 Levels
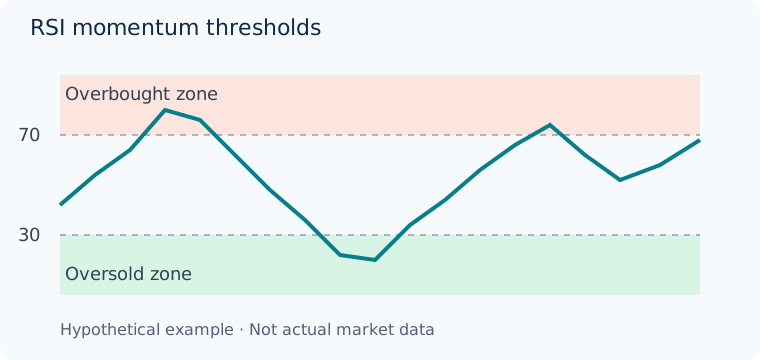
The traditional RSI interpretation uses three important reference levels: 70, 50, and 30.
When RSI rises above 70, the market is often described as overbought. This means that recent upward momentum has become unusually strong relative to recent losses. Some traders interpret this as a warning that the stock may be vulnerable to a pullback or consolidation.
When RSI falls below 30, the market is often described as oversold. Recent downward momentum has become unusually strong, potentially creating conditions for a recovery.
The 50 level provides a reference for the balance between upward and downward momentum. RSI above 50 generally indicates that recent gains are dominating losses, while RSI below 50 suggests the opposite.
These levels must be interpreted carefully. An overbought market can continue rising for a considerable time, particularly during a strong bullish trend. Similarly, an oversold market can continue falling during a powerful bearish trend.
Consequently, RSI should not be used as an automatic buy or sell signal simply because it crosses 70 or 30.
Three Important RSI Trading Techniques
1. Overbought and Oversold Conditions
The most familiar RSI strategy is to identify extreme readings and look for a possible change in price direction.
For example, if a stock falls sharply and RSI drops below 30, a trader might begin monitoring the market for evidence that selling pressure is weakening.
The actual trading decision could require additional confirmation, such as a break above a resistance level, a bullish candlestick formation, or a recovery in trading volume.
The same principle applies when RSI rises above 70. Rather than selling immediately, a trader might wait for a bearish price pattern or a break below support.
2. RSI Divergence
Divergence occurs when price and RSI move in different directions.
A bullish divergence develops when price makes a lower low while RSI forms a higher low. This indicates that the latest decline has not produced the same degree of downward momentum as the previous decline.
A bearish divergence develops when price makes a higher high while RSI forms a lower high. This suggests that upward momentum may be weakening even though price continues to rise.
Divergence can provide an early warning of a potential reversal, but it does not guarantee that one will occur. In strong trends, divergence may persist while price continues in its original direction.
3. The RSI 50-Level Momentum Strategy
The RSI 50 level can help traders evaluate whether momentum is strengthening or weakening.
A move above 50 may indicate that upward momentum is gaining control. A move below 50 may suggest that downward momentum is becoming dominant.
For trend-following traders, RSI can be combined with a moving average. For example, a trader might focus on bullish RSI signals only when the stock is trading above its long-term moving average.
This approach can help reduce the number of signals that conflict with the broader market direction.
Why RSI Is Useful – and Where It Can Mislead
RSI offers several advantages. It is relatively simple to understand, works across different markets and timeframes, and provides a consistent way to compare momentum conditions.
It can also help traders recognize changes that are not immediately obvious from the price chart. A stock may continue rising while RSI reveals that the strength behind the advance is gradually declining.
Nevertheless, RSI has limitations.
First, it is calculated from historical prices. It cannot predict unexpected news, sudden changes in market sentiment, or future price movements.
Second, the standard 14-period setting may not be suitable for every trading strategy. Shorter periods produce faster and more sensitive signals, while longer periods generally produce smoother readings.
Third, the same RSI value can mean different things in different market environments. During a strong uptrend, RSI may repeatedly find support around 40–50 rather than falling to 30. During a strong downtrend, RSI may struggle to rise above 50–60.
For these reasons, traders should study RSI in relation to the prevailing trend, price structure, support and resistance, and other relevant market information.
Conclusion: RSI as Part of a Complete Trading Method
The Relative Strength Index has remained an important technical indicator for decades because it helps traders examine an essential aspect of market behavior: momentum.
Its greatest value is not in identifying a single numerical level that supposedly guarantees a profitable trade. Instead, RSI provides a framework for examining the relationship between recent gains, recent losses, and the strength of price movements.
By combining RSI with price patterns, trend analysis, and carefully defined trading rules, traders can develop a more structured approach to identifying opportunities and evaluating risk.
A successful trading method requires more than an indicator. It requires a clear understanding of market conditions, consistent decision-making, and disciplined risk management. RSI can contribute meaningfully to that process when its strengths and limitations are understood.