Candlestick Charts: Four Prices in One Shape
A single candlestick shows how buyers and sellers fought over one period of time. Learn to read its shape and you can sense the mood of a market at a glance.
Where candlesticks come from
Candlestick charting is traditionally traced to Munehisa Homma, a rice trader in the Dojima market of Osaka in the 1700s. The story goes that he noticed prices moved not only on supply and demand but also on the fear and greed of traders, and he recorded each session in a form that made that emotion visible. Japanese traders refined the method over generations, while Western chartists stayed with bar charts until Steve Nison’s 1991 book Japanese Candlestick Charting Techniques introduced it to a wider audience. Today it is the default view on almost every trading platform.
Anatomy of a candle
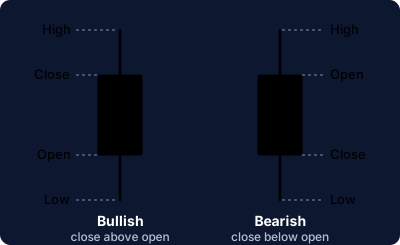
Each candle summarises one period, from a single minute to a whole month, using four prices: open, high, low and close. The thick part, the body, spans the open and the close. The thin lines above and below, the wicks or shadows, reach the highest and lowest prices traded. When the close is above the open the candle is bullish, usually drawn green or hollow. When the close is below the open it is bearish, usually red or filled. Colours are only a convention, so check your platform’s settings.
What the shape tells you
A long body shows conviction: one side controlled the period. A short body shows hesitation. A long wick shows rejection. A long upper wick means buyers pushed the price up but sellers drove it back; a long lower wick means the reverse. Meaning grows when candles are read together, which is why traders study short sequences called patterns.
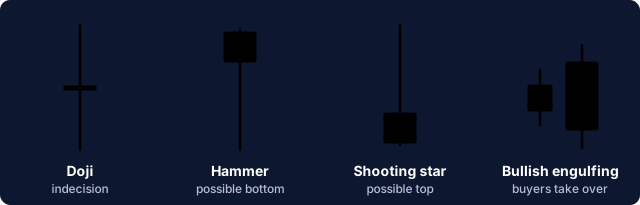
- Doji: open and close are almost equal. It marks a pause, often after a strong move.
- Hammer: a small body on top of a long lower wick after a decline. Sellers pushed down but buyers recovered, which can precede a bounce.
- Shooting star: the mirror image after an advance, with a long upper wick. It can warn that buyers are tiring.
- Bullish engulfing: a green body that completely covers the previous red body. Its opposite, the bearish engulfing, covers a green body with a red one.
Using them with care
A pattern is a probability, not a prediction. The same hammer means far more at a well-tested support level, on rising volume, than in the middle of a quiet range. Wait for the next candle to confirm it, read it within the larger trend, and combine it with tools such as moving averages, RSI and volume. Decide where you will exit before you enter, because even the best-looking signal fails regularly.
Educational content only. It is not investment advice, and trading involves risk of loss.