Renko Charts: A Clearer Way to Read Price Trends
Renko charts simplify price action by building uniform bricks only after price has moved a set distance. They can make trends easier to see—but they also hide time and can react late.
Renko is a price-charting method that places the emphasis on how far price moves, rather than how much time passes. Its name is commonly connected to the Japanese word renga, meaning “brick,” because the chart is built from blocks. Renko is associated with Japanese charting traditions, but its exact origin and inventor are not reliably established. It later became familiar to Western traders through books and charting platforms that introduced alternative ways of reading price movement.
How Renko bricks form
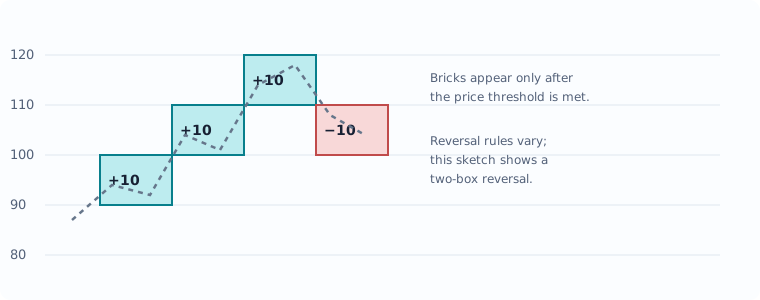
A Renko chart uses a chosen box size. A new brick is drawn when price has moved far enough to complete that distance. If the box size is 10 price units, a rise from 100 to 110 can create an upward brick; a further move to 120 can create another. Small fluctuations that do not complete a brick are usually left off the chart.
Many Renko implementations require price to move roughly two box sizes in the opposite direction before a reversal brick is drawn. This convention helps avoid constantly switching direction, although platforms differ in their reversal rules and in the prices used to construct bricks. Always check the chart’s settings before comparing examples.
What Renko can reveal
By filtering out moves smaller than the box size, Renko can make sustained directional movement, pauses, and larger reversals easier to recognize. Some traders use it to keep their attention on trend structure instead of every short-lived fluctuation. The trade-off is that the chart becomes less detailed: the timing and path of price between completed bricks are not fully visible.
Renko versus candlesticks
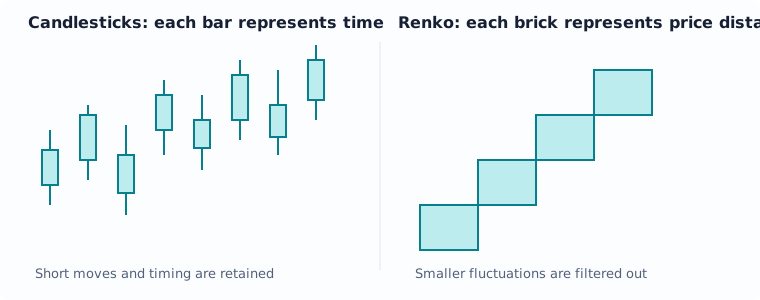
| Feature | Renko | Candlesticks |
|---|---|---|
| When a new shape appears | After a price move reaches the box threshold | At each chosen time interval |
| Main emphasis | Price movement and direction | Price movement within time-based periods |
| What may be easier to see | Persistent trends and larger turns | Intraperiod volatility, gaps, and timing |
| Main trade-off | Time information is obscured; signals can lag | More noise may appear in choppy markets |
Choosing a box size
A small box size makes Renko more responsive but can produce many bricks and more false turns. A larger box size filters more movement, yet the chart may confirm a trend or reversal later. Some platforms use a fixed price amount; others calculate a changing size from a volatility measure such as Average True Range (ATR). Fixed and ATR-based charts can look very different, so the sizing method should be documented when reviewing a strategy.
Important limitations
Renko bricks are constructed from price thresholds, not necessarily from prices at which a trader could have executed an order. A chart may omit intrabrick highs, lows, gaps, and the time taken to form each brick. Reversal confirmation also introduces lag. Backtests that treat each brick close as an automatically tradable fill can therefore overstate performance; use realistic execution assumptions and verify signals against time-based price data.
Educational material only. This article is not investment advice or a recommendation to buy or sell any financial instrument.