Technical Analysis
Williams %R: The Inverted Stochastic
Williams %R is, mathematically, the stochastic oscillator with an inverted scale. Where the stochastic measures the position of the close within the recent range on a 0–100 scale, Williams %R measures the same thing on a -100–0 scale. A reading of -20 in Williams %R corresponds to a reading of 80 in the stochastic. The two indicators carry the same information; the difference is presentation.
The indicator was developed by Larry Williams, and it is calculated as the highest high minus the close, divided by the highest high minus the lowest low, multiplied by -100. The inversion is the source of most of the confusion. Traders accustomed to the stochastic's scale read a Williams %R of -80 as "low" when it actually corresponds to a stochastic reading of 20, which is oversold.
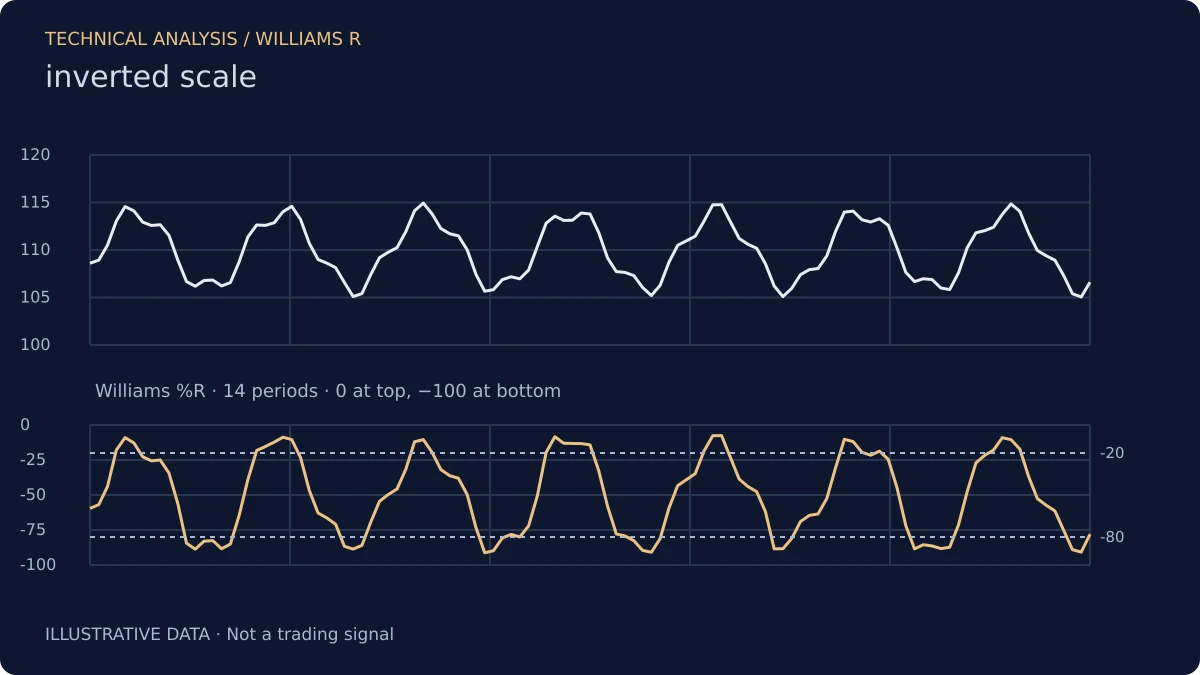
The Scale and Its Consequences
The inverted scale means that overbought readings are near 0 and oversold readings are near -100. The conventional thresholds are -20 for overbought and -80 for oversold. The thresholds are the stochastic's 80/20 thresholds, reflected across the midpoint.
The inversion is not just cosmetic. It changes the visual reading. A rising Williams %R line moves upward toward zero. A falling line moves downward toward -100. The vertical direction is the same as on a standard stochastic chart; it is the numerical labels that differ. Confusing a smaller absolute value with a lower plotted value is a source of errors for traders who switch between the two indicators.
Reading the Signal
The signal is the same as the stochastic's: readings near the extremes describe the close near the top or bottom of the range, and crossovers of a smoothed version of the indicator can be used as entry and exit signals. The interpretation depends on the regime. In a range, extremes are mean-reversion signals. In a trend, extremes describe persistence.
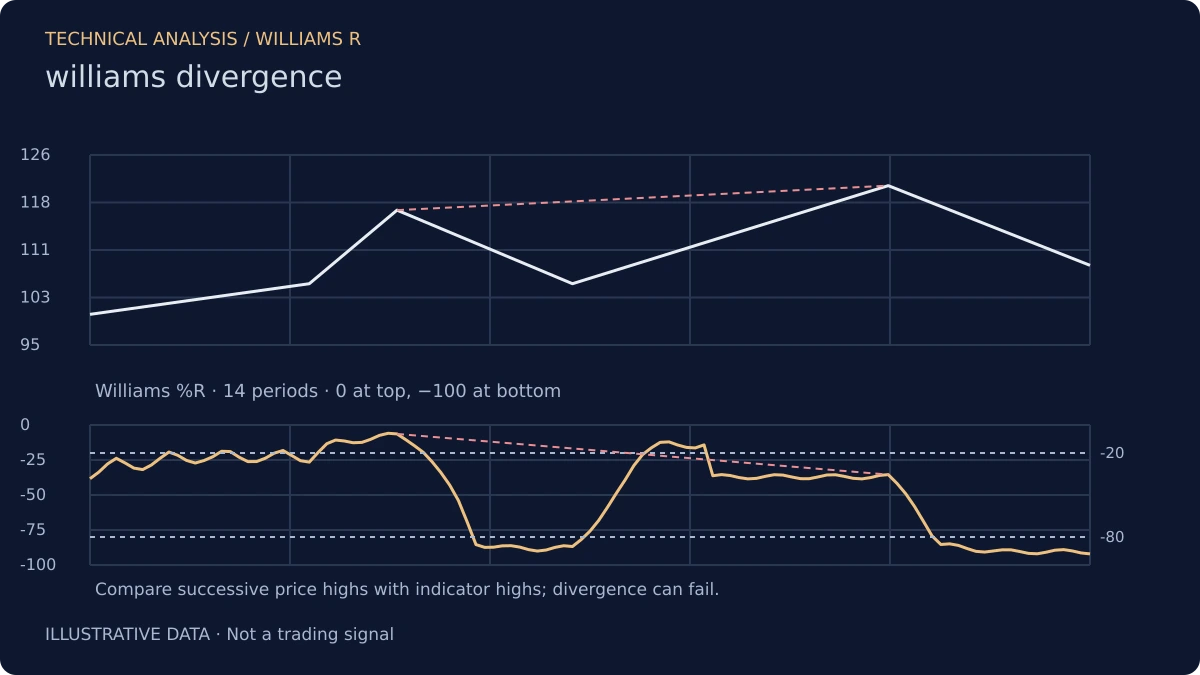
The divergence signal is also the same: price making a new high while Williams %R makes a lower high (a reading closer to -100, which is lower on the inverted scale) describes a weakening of the close's position within the range. The signal is more sensitive than MACD or RSI divergence, and more prone to false positives.
Why Use It at All
Given that Williams %R is mathematically equivalent to the stochastic, the obvious question is why anyone would use it. The answer is largely historical and stylistic. Some traders prefer the inverted scale because it aligns with the way they think about price (lower readings = weaker), and some platforms present Williams %R more prominently than the stochastic.
The practical point is that the choice between the two is a matter of preference, not of analytical content. A trader who understands one understands the other. The important thing is to be consistent: switching between the two without adjusting the thresholds is a recipe for confusion.
The Smoothing Question
Like the stochastic, Williams %R can be smoothed to reduce noise. The raw version is more responsive; the smoothed version is slower but less prone to whipsaw. The choice depends on the timeframe and the trading style, and it should be made explicitly rather than by default.
What Williams %R Does Not Do
It does not measure momentum in the way MACD does. It does not predict reversals. It measures the position of the close within the recent range, on an inverted scale, and it makes that position visible. Used with an understanding of the inversion, it is a valid tool. Used without that understanding, it is a source of sign errors.
Risk Disclosure: The above content is a discussion of technical analysis methods only and does not constitute any investment advice. Williams %R carries lag and the possibility of misjudgment; no single indicator should be the sole basis for trading decisions. Markets carry risk; decisions must be independent.