Technical Analysis
OBV: Volume Directed by Price
On-Balance Volume is a running total that adds volume on up days and subtracts it on down days. The result is a single line that rises when up-day volume dominates and falls when down-day volume dominates. The indicator was introduced by Joseph Granville in 1963, and its premise is that volume precedes price: the direction of volume flow anticipates the direction of price.
The calculation is simple. If the close is higher than the previous close, add the current volume to the running total. If the close is lower, subtract it. If the close is unchanged, do nothing. The result is a cumulative line whose absolute value is arbitrary but whose direction and slope are meaningful.
What OBV Measures
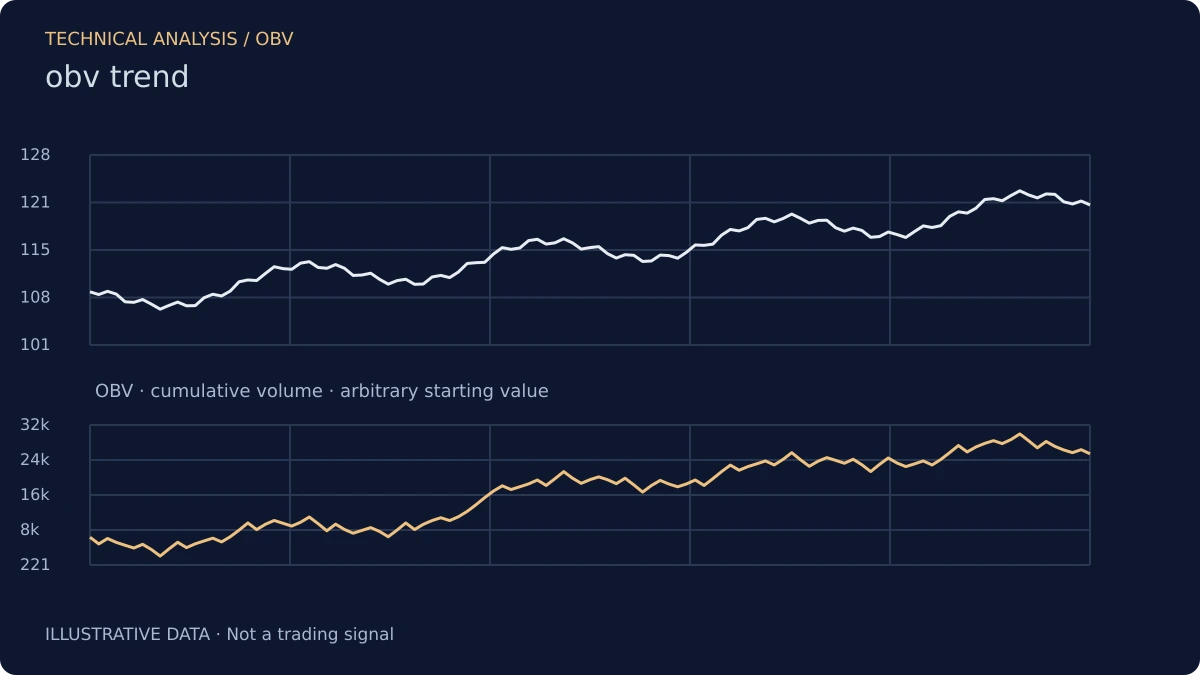
OBV measures the cumulative balance of volume on up days versus down days. A rising OBV means up-day volume is dominating; a falling OBV means down-day volume is dominating. The line is a proxy for whether buyers or sellers are more active, weighted by the size of their activity.
The proxy is imperfect. A large block trade executed on a down day will subtract from OBV even if the trade was a buy, because OBV uses the direction of the close, not the direction of the trade. The indicator is a simplification, and the simplification is the source of both its usefulness and its limitations.
Divergence as the Primary Signal
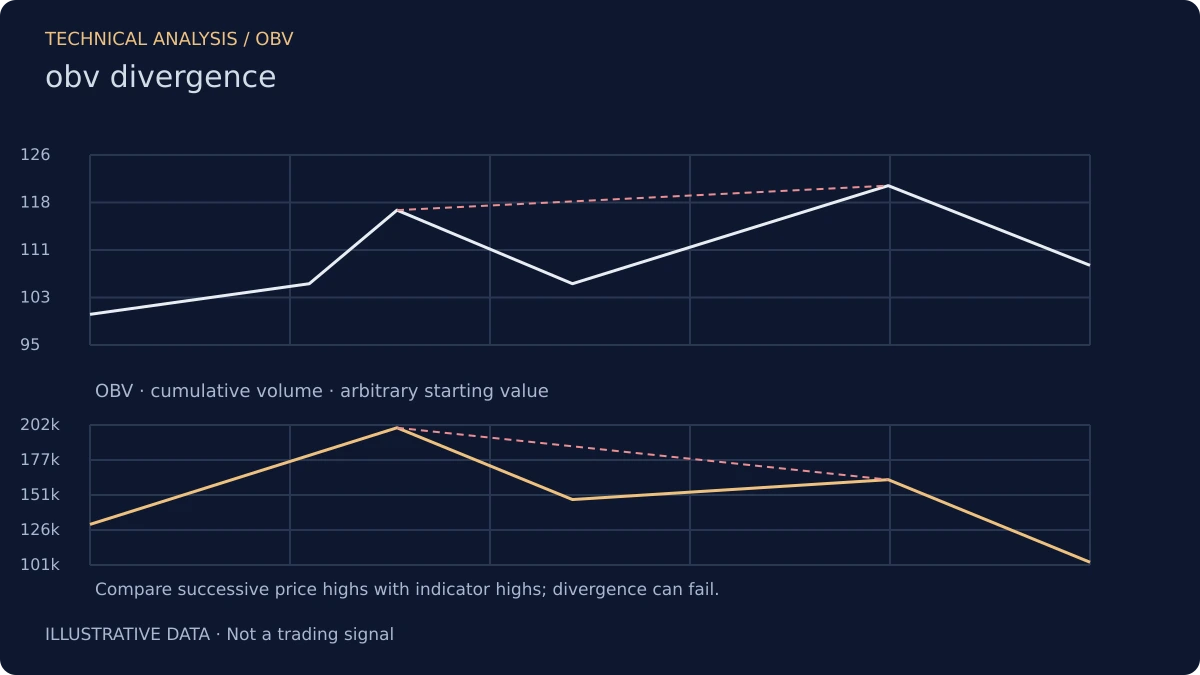
The most discussed use of OBV is divergence: price makes a new high while OBV makes a lower high, or price makes a new low while OBV makes a higher low. The divergence suggests that the volume flow is not confirming the price move, which is a warning that the move may not be supported by genuine participation.
The signal is more reliable at the end of extended trends than at the beginning. In a young trend, OBV divergence often resolves in the direction of the trend; in an old trend, it more often marks a transition. The context matters, as it does for all divergence signals.
OBV and Trend Confirmation
A less discussed but more robust use of OBV is trend confirmation. When price is trending and OBV is trending in the same direction, the trend has volume support. When price is trending and OBV is flat or trending in the opposite direction, the trend is suspect.
The confirmation reading is less prone to false positives than divergence because it does not require a specific pattern; it only requires agreement. The cost is that confirmation is a slower signal: by the time OBV has clearly confirmed a trend, a meaningful part of the move has already happened.
The Cumulative Nature and the Starting Point
Because OBV is cumulative, its absolute value depends on the starting point. Two traders who start their OBV calculation on different dates will get different absolute values, though the direction and slope will be the same after a sufficient number of periods. The absolute value is not meaningful; the shape is.
This is a common source of confusion. A trader who sees OBV at 50,000 on one platform and 12,000 on another may think the indicator is broken. It is not; the starting points differ. The shape is what matters.
What OBV Does Not Do
It does not measure the direction of individual trades. It does not predict price. It measures the cumulative balance of volume on up days versus down days, and it makes that balance visible. Used as a divergence detector and as a trend confirmation tool, it is useful. Used as a precise predictor, it will mislead.
Risk Disclosure: The above content is a discussion of technical analysis methods only and does not constitute any investment advice. OBV carries lag and the possibility of misjudgment; no single indicator should be the sole basis for trading decisions. Markets carry risk; decisions must be independent.