Technical Analysis
Keltner Channels: Volatility as an Envelope
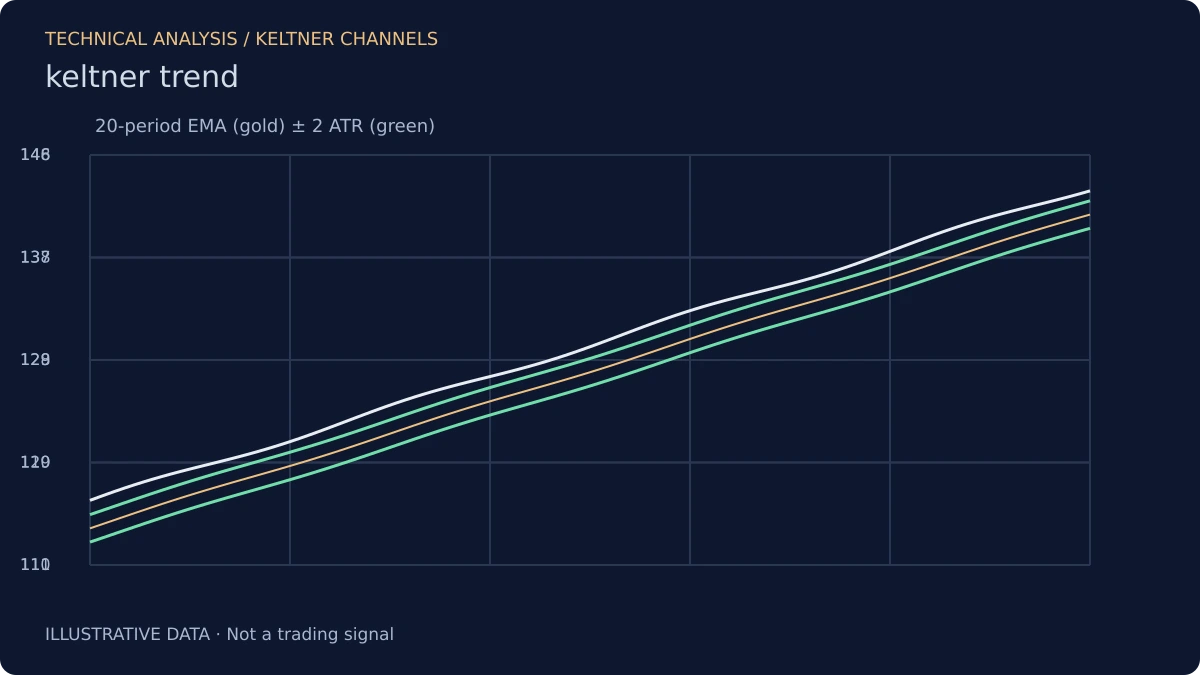
Keltner Channels are a volatility envelope built around an exponential moving average. The middle line is an EMA, typically 20 periods. The upper and lower bands are placed at a multiple of Average True Range above and below the middle line, typically 2 ATR. The result is a channel that widens when volatility rises and narrows when it falls, similar in spirit to Bollinger Bands but different in construction.
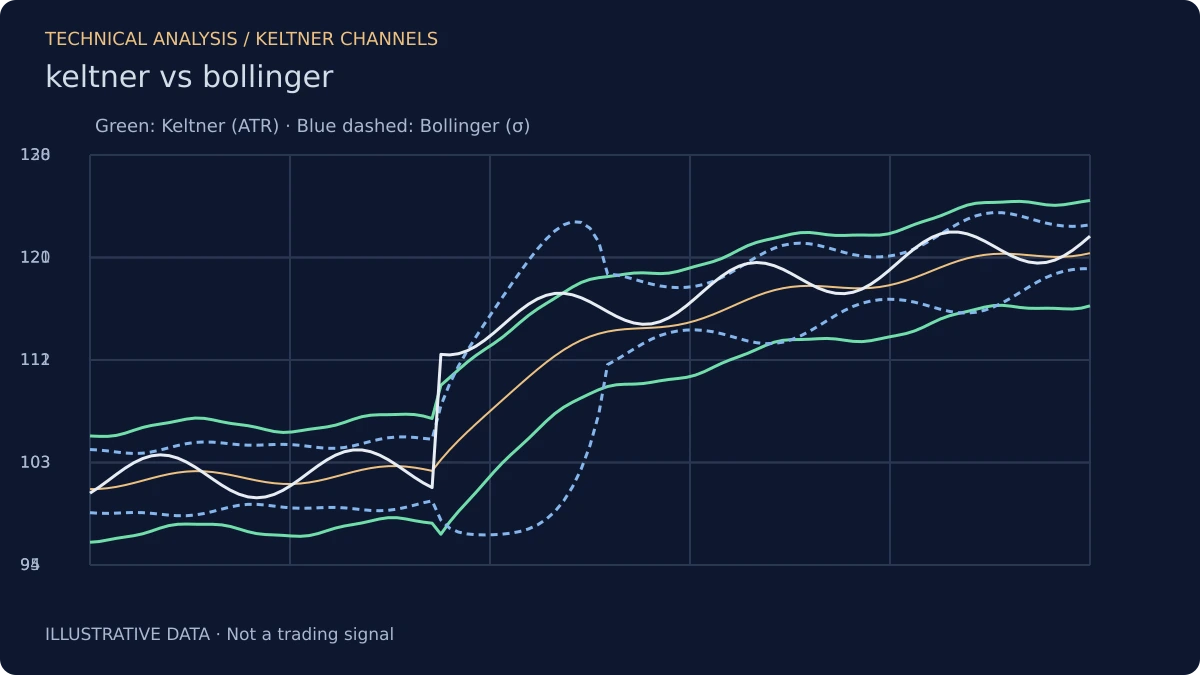
The difference is the measure of volatility. Bollinger Bands use standard deviation; Keltner Channels use ATR. Standard deviation measures dispersion around the mean; ATR measures the average size of the price range. The two measures are correlated but not identical, and the difference matters in practice.
Why ATR Instead of Standard Deviation
The choice of ATR has consequences. ATR includes gaps and reflects the full range of each period, not just the close-to-close dispersion. In markets with frequent gaps, Keltner Channels will be wider than Bollinger Bands, because the gaps are included in the volatility measure.
ATR is also less sensitive to outliers than standard deviation. A single large move will increase standard deviation more than it will increase ATR, because standard deviation squares the deviations. The result is that Bollinger Bands react more sharply to single large moves than Keltner Channels do.
The Middle Line and the Trend
The EMA middle line is a trend reference. When price is above the middle line and the line is rising, the trend is up. When price is below and the line is falling, the trend is down. The channels around the line describe the expected range of price given the current trend and volatility.
The combination is useful because it separates trend from volatility. The middle line describes the trend; the width of the channels describes the volatility. A trader can read both dimensions from a single indicator.
The Channel Breakout
A close outside the channel is a volatility event. In a trend, price can ride the channel for extended periods, touching or exceeding the bands repeatedly. The touch is not a reversal signal; it is a description of the fact that price is at the edge of its expected range.
The meaningful signal is the failure to reach the channel. When a trend that had been pushing to the upper band fails to reach it on a subsequent advance, the trend is weakening. The same logic applies to the lower band in a downtrend.
Keltner Versus Bollinger
The two channel indicators are often compared, and the comparison is useful. Bollinger Bands are more responsive to sharp moves; Keltner Channels are smoother. Bollinger Bands are better for identifying the squeeze; Keltner Channels are better for trend following.
Some traders use both together: a Bollinger squeeze that resolves with price pushing outside the Keltner Channel is a stronger signal than either alone. The two indicators are not redundant; they describe different aspects of the same volatility.
What Keltner Channels Do Not Do
They do not predict price. They do not identify reversals. They describe the current trend and volatility as an envelope around an EMA, and they make that envelope visible. Used as a trend and volatility frame, they are useful. Used as a mechanical breakout signal, they will produce false signals in ranges.
Risk Disclosure: The above content is a discussion of technical analysis methods only and does not constitute any investment advice. Keltner Channels carry lag and the possibility of misjudgment; no single indicator should be the sole basis for trading decisions. Markets carry risk; decisions must be independent.