Technical Analysis
Donchian Channels: The Highest High and Lowest Low
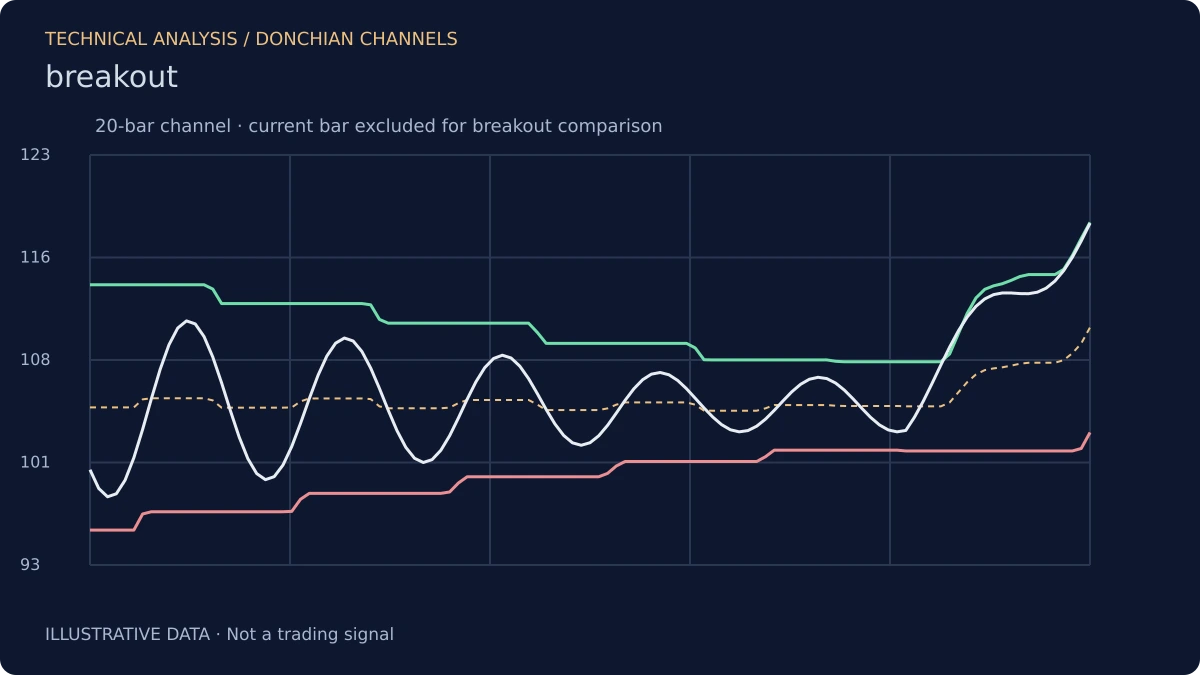
Donchian Channels are the simplest volatility envelope in common use. The upper band is the highest high over a lookback period; the lower band is the lowest low over the same period. The middle band is the average of the two. There is no smoothing, no standard deviation, no ATR. The indicator is a direct readout of the recent range.
The simplicity is the point. Where Bollinger Bands and Keltner Channels use statistical measures to describe volatility, Donchian Channels use the actual extremes of the recent price action. The channels describe the range that price has actually traveled, not a statistical estimate of where it should travel.
The Breakout Logic
The most common use of Donchian Channels is breakout trading. For breakout comparisons, the bands must exclude the current bar. A close above the prior upper band is a breakout to a new high over the lookback period; a close below the prior lower band is a breakout to a new low. The signals are unambiguous, which is rare in technical analysis.
The classic turtle trading system used a 20-period Donchian breakout as its entry signal, with a shorter-period channel for exits. The system is a trend-following approach: it enters on breakouts and exits on reversals, accepting a lower win rate in exchange for large wins on the trends that follow through.
The Lookback Period
The lookback period determines the sensitivity of the channels. A short period produces frequent breakouts, many of them false. A long period produces fewer breakouts, but the ones that occur are more significant. The choice depends on the timeframe and the trading style.
The period is a modeling choice, not a discovery. A 20-period channel and a 55-period channel describe different things, and both descriptions can be true. The trader should be explicit about which period they are using and why.
The Middle Band as a Trend Reference
The middle band—the average of the upper and lower bands—is a trend reference. When price is above the middle band, the recent range has been rising; when below, it has been falling. The middle band is slower than the price itself, and it can be used as a trailing stop or as a trend filter.
The middle band is not a moving average in the traditional sense, but it behaves similarly. It lags the price, and it describes the center of the recent range. The lag is the cost of the smoothing, as with any trend reference.
Donchian and Volatility
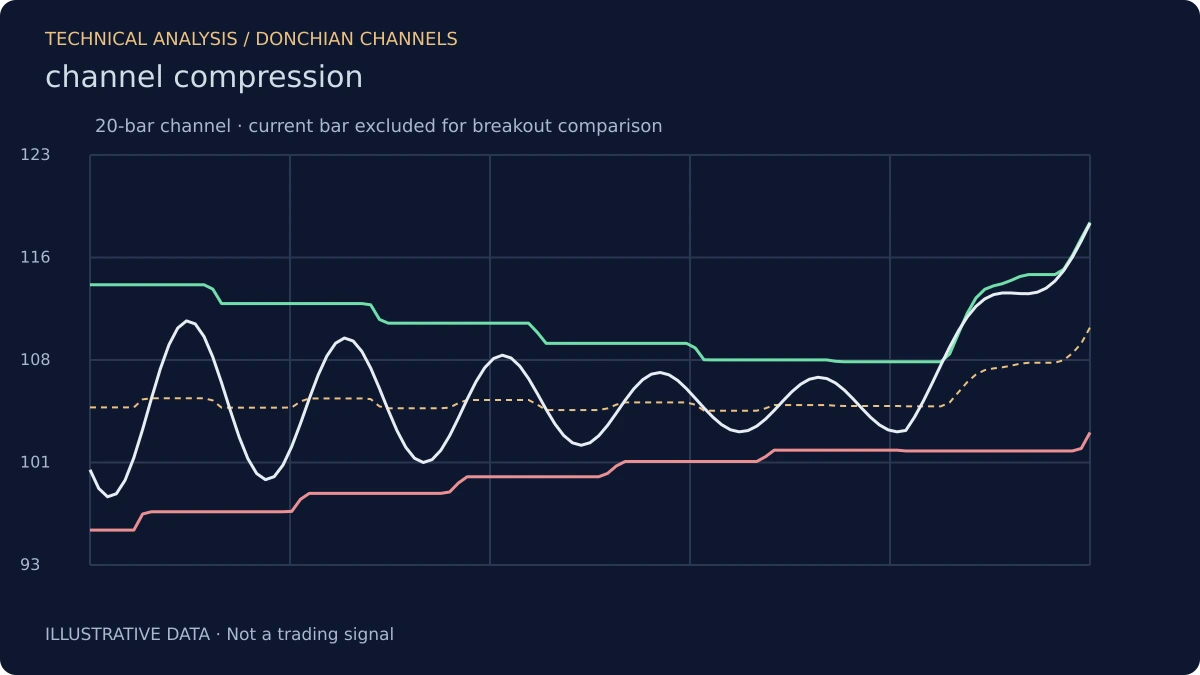
The width of the Donchian Channels is a direct measure of the recent range. A wide channel describes a market that has been moving; a narrow channel describes a market that has been quiet. The width is not normalized, so it is not directly comparable across assets, but it is comparable within an asset over time.
A narrowing channel is a compression signal, similar to the Bollinger squeeze. The compression is a precondition for expansion, though the direction of the expansion is not specified.
What Donchian Channels Do Not Do
They do not predict price. They do not identify the direction of a breakout before it occurs. They describe the recent range and make the breakout levels visible. Used as a breakout system, they are the basis for many trend-following strategies. Used as a prediction tool, they are a description of the past, extended forward as a hypothesis.
Risk Disclosure: The above content is a discussion of technical analysis methods only and does not constitute any investment advice. Donchian Channels carry lag and the possibility of misjudgment; no single indicator should be the sole basis for trading decisions. Markets carry risk; decisions must be independent.