Technical Analysis
Volume Profile: Where the Market Actually Traded
Volume Profile is a different way of looking at volume. The conventional volume histogram plots volume against time, answering the question "when did trading happen." Volume Profile plots volume against price, answering the question "at what prices did trading happen." The two views are complementary, and the price view is often more useful for identifying support and resistance.
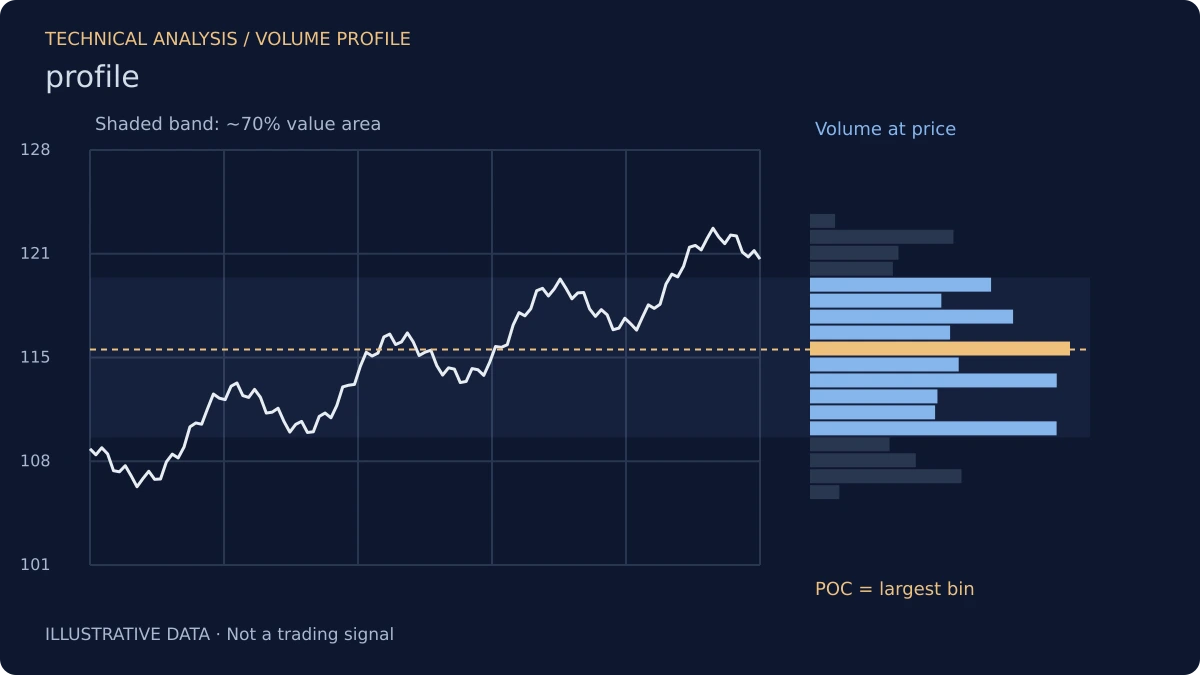
The indicator is constructed by taking the volume from each period in the lookback window and assigning it to the price level at which it occurred. The result is a horizontal histogram, with long bars at prices where a lot of trading occurred and short bars at prices where little occurred. The shape of the histogram is the profile.
The Point of Control
The point of control is the price level with the highest volume in the profile. It is the price at which the most trading occurred, and it is often treated as a reference point. When price returns to the point of control, the reaction is often meaningful, because the level represents a price where a large number of participants transacted.
The point of control is not a support or resistance level in the traditional sense. It is a level of high participation, and its significance depends on context. In a balanced market, the point of control is the center of the range; in a trending market, it may be less relevant.
The Value Area
The value area is the range of prices that contains approximately 70% of the volume in the profile. The 70% threshold is a convention, derived from the idea that a normal distribution contains about 70% of its mass within one standard deviation of the mean. The value area describes the price range where most of the trading occurred.
Prices outside the value area are prices where little trading occurred. These prices are often described as "unfair" in the sense that the market did not spend much time there. When price moves outside the value area, it is often moving quickly, because there is little volume to slow it down.
High-Volume Nodes and Low-Volume Nodes
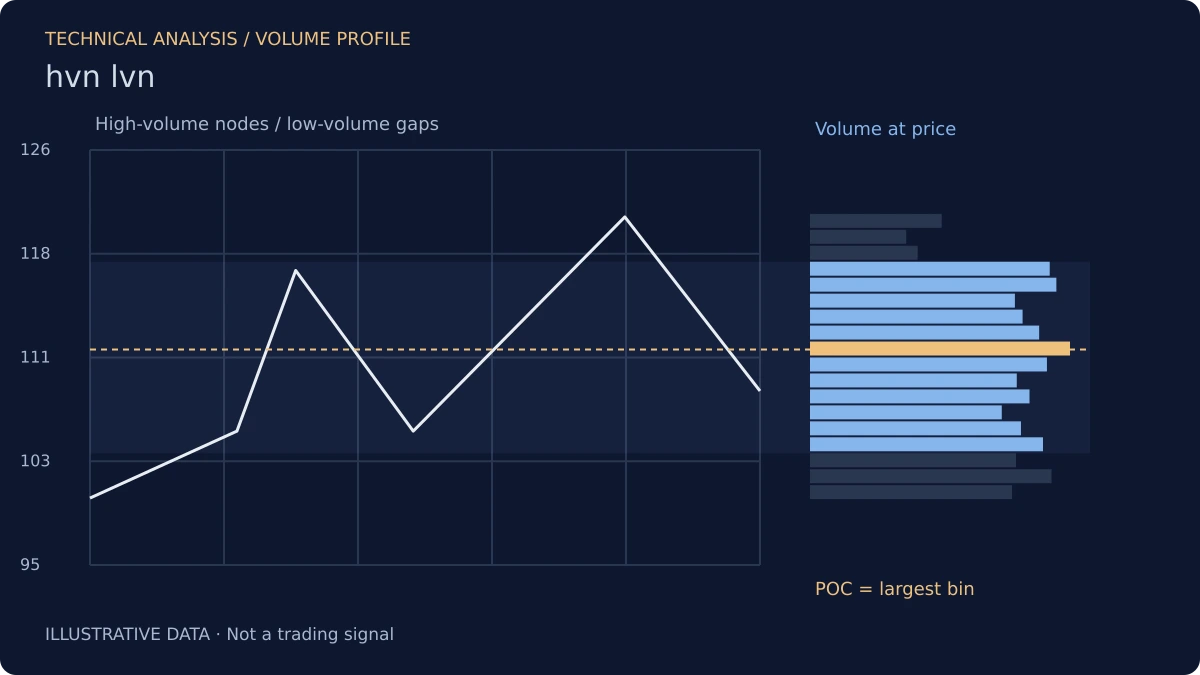
The profile is characterized by high-volume nodes—prices where a lot of trading occurred—and low-volume nodes—prices where little occurred. High-volume nodes tend to act as support or resistance, because price tends to react at levels where many participants have transacted. Low-volume nodes tend to be traversed quickly, because there is little volume to provide support or resistance.
The distinction between the two is the basis for much of the practical use of Volume Profile. A price approaching a high-volume node is approaching a level where a reaction is likely. A price approaching a low-volume node is approaching a level where a rapid move is likely.
The Lookback Window
The profile is calculated over a lookback window, and the choice of window affects the shape. A short window produces a profile that reflects recent activity; a long window produces a profile that reflects the broader range. The window should be chosen to match the horizon being traded.
The window is a modeling choice, like the period of a moving average. Different windows produce different profiles, and the trader should be explicit about the choice.
What Volume Profile Does Not Do
It does not predict price. It does not identify the direction of the next move. It describes where the market has actually traded, and it makes that distribution visible. Used as a frame for identifying support, resistance, and high-participation levels, it is one of the more informative tools available. Used as a mechanical signal, it is a description of the past.
Risk Disclosure: The above content is a discussion of technical analysis methods only and does not constitute any investment advice. Volume Profile carries lag and the possibility of misjudgment; no single indicator should be the sole basis for trading decisions. Markets carry risk; decisions must be independent.