Technical Analysis
Parabolic SAR: A Trailing Stop That Accelerates
Parabolic SAR stands for Stop and Reverse, and the name describes both the calculation and the intended use. The indicator plots a series of dots above or below price. When price is trending up, the dots are below; when price is trending down, the dots are above. When price crosses the dots, the indicator flips, and the new dots appear on the other side.
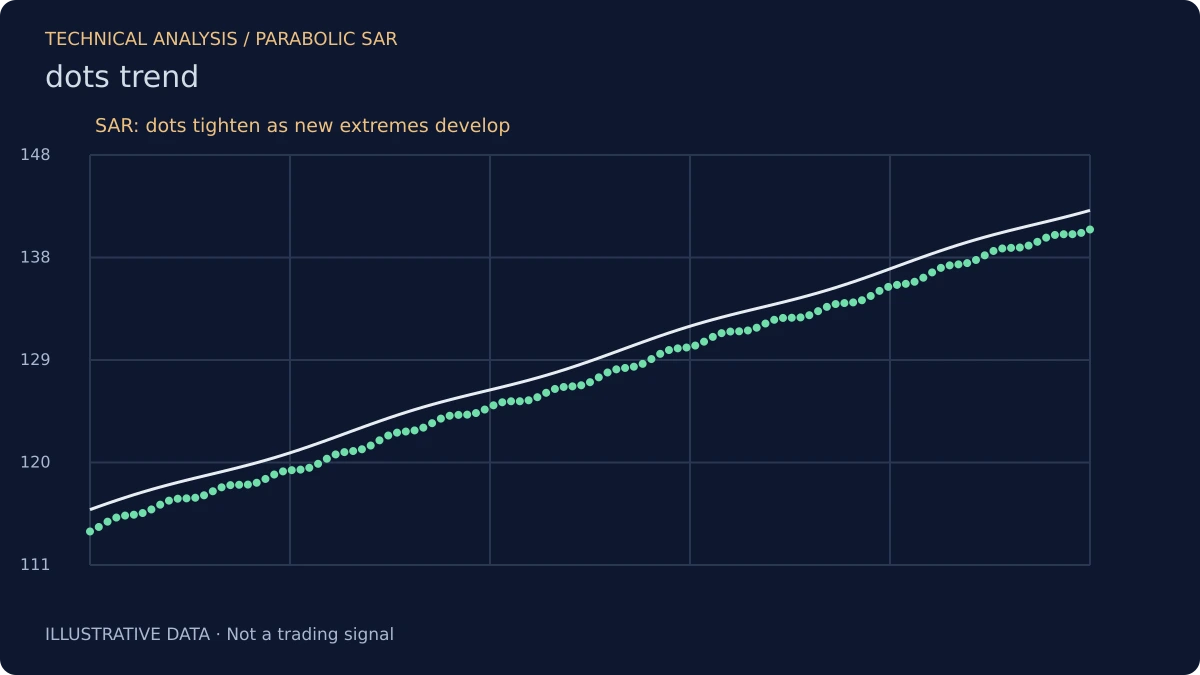
The calculation is recursive. Each new dot is placed at a distance from the prior extreme, and that distance grows as the trend continues. The growth is controlled by the acceleration factor, which starts at 0.02 and increases by 0.02 each time a new extreme is reached, up to a maximum of 0.20. The result is a stop that accelerates as the trend extends.
The Logic of Acceleration
The acceleration factor is the distinctive feature. In a young trend, the stop moves slowly, giving the trend room to develop. As the trend extends and makes new extremes, the stop moves faster, tightening the distance between price and the stop. The logic is that a trend that has been running for a long time is more likely to reverse, so the stop should be tighter.
The maximum of 0.20 caps the acceleration. Without the cap, the stop would eventually overtake price and force a premature exit. The cap ensures the stop remains behind price, even in extended trends.
Stop and Reverse Versus Trailing Stop
The indicator was designed as a stop-and-reverse system: when the stop is hit, the position is closed and reversed. In practice, the reverse signal is less reliable than the stop signal. The flip from up to down is a genuine change in the indicator's state, but it is not a prediction of a downtrend. It is a description of the fact that price has moved below the stop level.
The trailing stop use is more defensible. The dots provide a dynamic stop level that adjusts to the trend, and closing a position when price crosses the dots is a disciplined way to lock in gains without a fixed target. The stop does not predict; it protects.
The Whipsaw Problem
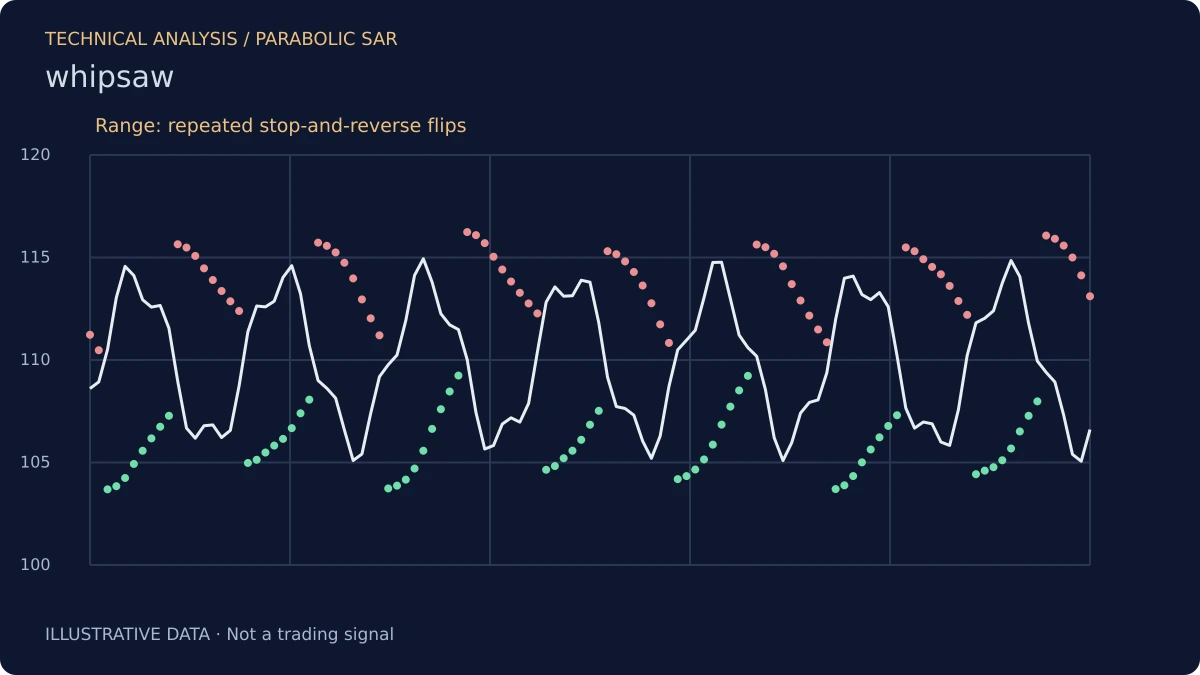
Parabolic SAR is prone to whipsaw in choppy markets. When price oscillates without a clear trend, the dots flip repeatedly, generating a series of stop signals that are each followed by a reversal. The result is a series of small losses that can add up.
The standard remedy is to use the indicator only when a trend is already established, filtered by a trend measure such as ADX or a moving average. The filter does not eliminate whipsaw, but it reduces its frequency by restricting the indicator's use to regimes where it is more likely to work.
The Initial Placement and the First Signal
The first dot in a new trend is placed at the prior extreme. The placement matters because it determines the initial stop distance. If the prior extreme is far from price, the first stop is wide; if it is close, the first stop is tight. The initial placement is a judgment call, and different platforms implement it slightly differently.
The first signal after a flip is the most important, because it establishes the trend. A flip that is followed by a sustained move in the new direction is a stronger signal than a flip that is immediately reversed. The follow-through is the confirmation.
What Parabolic SAR Does Not Do
It does not predict the end of a trend. It does not work in all market regimes. It describes a stop level that accelerates with the trend, and it makes that level visible. Used as a trailing stop, it is a disciplined tool for protecting gains. Used as a standalone entry signal, it will produce whipsaws in ranging markets and miss the early part of trends in trending ones.
Risk Disclosure: The above content is a discussion of technical analysis methods only and does not constitute any investment advice. Parabolic SAR carries lag and the possibility of misjudgment; no single indicator should be the sole basis for trading decisions. Markets carry risk; decisions must be independent.