Technical Analysis
CCI: Deviation From the Typical Price
The Commodity Channel Index was developed by Donald Lambert in 1980 for commodity markets, but it has since been applied to equities, currencies, and virtually every other tradable. The name is misleading: CCI is not a channel indicator in the way Bollinger Bands or Keltner Channels are. It is a measure of how far the typical price has deviated from its moving average, normalized by mean deviation.
The typical price is (high + low + close) / 3. The CCI subtracts the moving average of the typical price from the current typical price, divides by 0.015 times the mean deviation, and plots the result. The 0.015 constant is a scaling factor chosen by Lambert to make roughly 70–80% of readings fall between -100 and +100. The constant is a convention, not a mathematical necessity.
What the Number Means
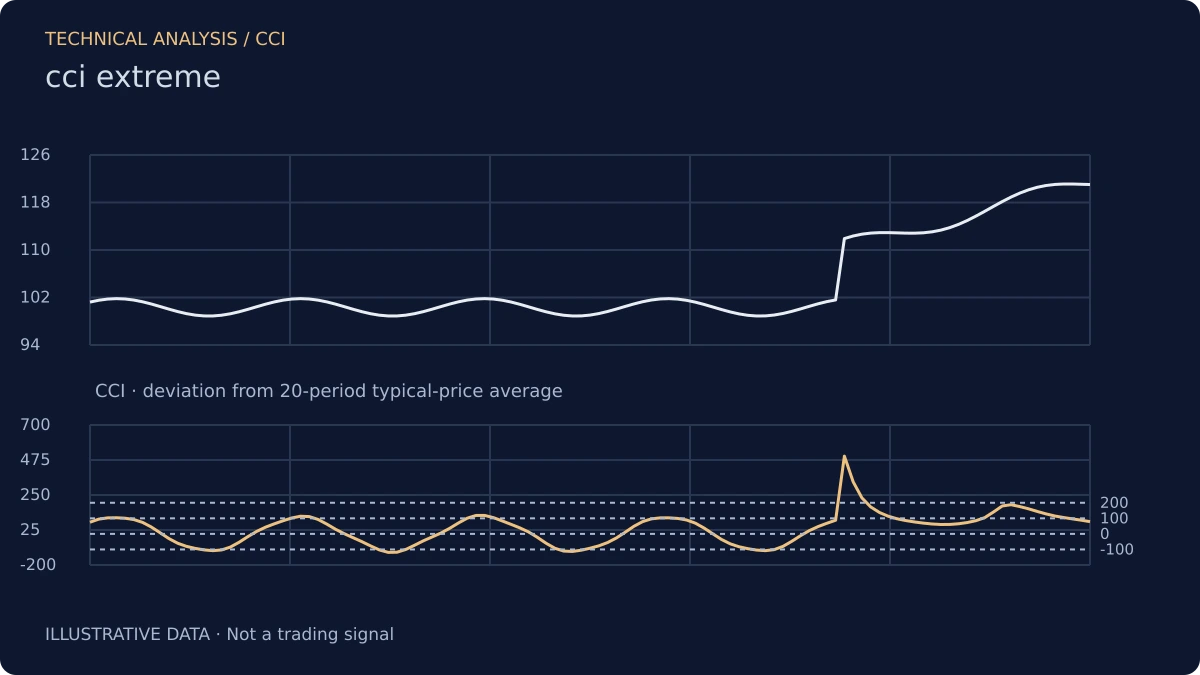
The conventional thresholds are +100 for overbought and -100 for oversold. A reading above +100 means the typical price is unusually far above its average; a reading below -100 means it is unusually far below. The thresholds are statistical, not magical: they describe how far the current reading is from the average, scaled by the typical dispersion.
The indicator is unbounded, which distinguishes it from RSI and the stochastic. A reading of +200 is possible and meaningful; it describes an extreme deviation. The unbounded nature makes CCI useful for identifying extremes that bounded indicators would cap.
Deviation, Not Momentum
The distinction between CCI and momentum indicators is important. CCI does not compare gains to losses, and it does not measure the rate of change of price. It measures the distance between the typical price and its average, normalized by dispersion. The signal is about how far price has moved from its center, not how fast it is moving.
This distinction matters in trends. A strong trend can produce a sustained CCI reading above +100, because the typical price is persistently above its average. That is not overbought in an actionable sense; it is a trend. The reading is a description of the deviation, not a prediction of reversal.
Zero-Line Crossovers
The zero-line crossover is a directional signal: CCI crossing above zero means the typical price has moved above its average; crossing below means it has moved below. The signal is similar in spirit to a moving average crossover, but based on the typical price rather than the close.
The crossover is more responsive than a moving average crossover because the typical price incorporates the high and low, not just the close. The trade-off is more noise. In choppy markets, CCI will cross zero repeatedly.
Divergence
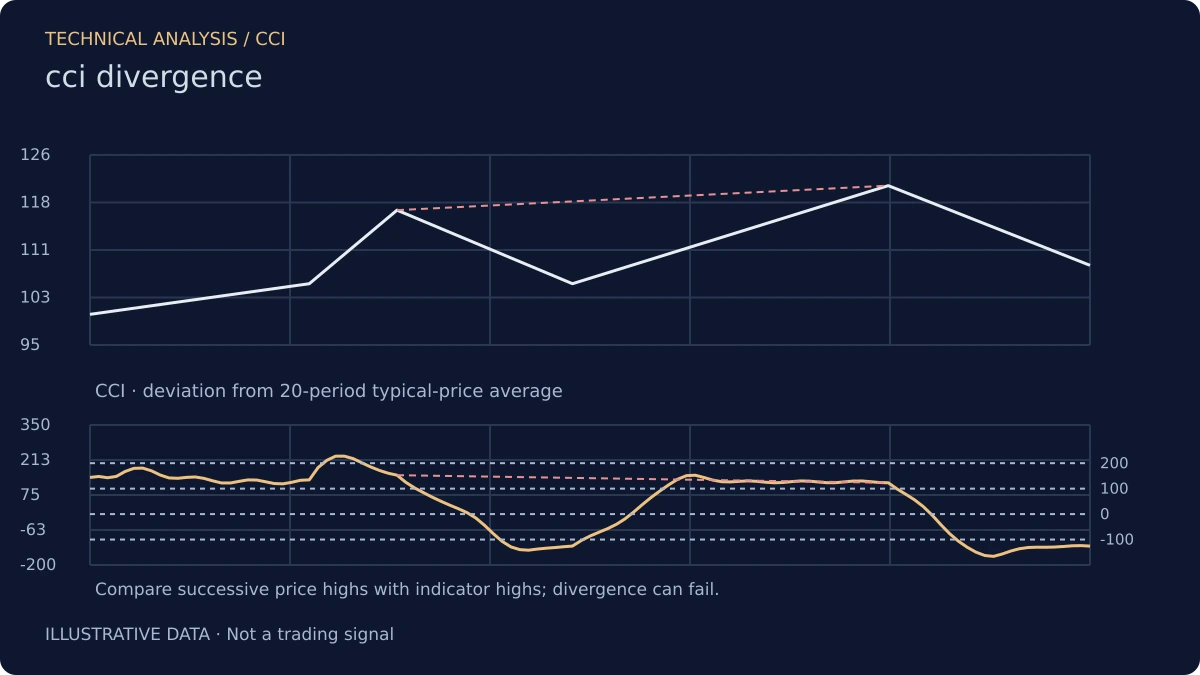
CCI divergence—price making a new high while CCI makes a lower high—is a signal that the deviation from the average is not extending as price extends. The signal is similar to RSI divergence, but the underlying calculation is different, so the two indicators do not always agree. When they do agree, the signal is stronger.
What CCI Does Not Do
It does not measure momentum in the way MACD does. It does not identify the end of a trend. It measures the deviation of the typical price from its average, normalized by dispersion, and it makes that deviation visible. Used as an extreme detector and as a divergence tool, it is useful. Used as a mechanical overbought/oversold trigger, it will produce false signals in trends.
Risk Disclosure: The above content is a discussion of technical analysis methods only and does not constitute any investment advice. CCI carries lag and the possibility of misjudgment; no single indicator should be the sole basis for trading decisions. Markets carry risk; decisions must be independent.