Volume Analysis
In technical analysis, volume is often reduced to "the height of the bars," but its essence is far more concrete than most traders realize.
But that is only the entry point. What really needs discussion is the role volume plays in price behavior.
What Volume Actually Is
Volume is the number of shares or contracts traded within a given period. Its calculation is extremely simple—just accumulate—no weighting, no complex formula. Precisely because it is simple, it is often underestimated.
The core purpose of a technical analyst's attention to volume is singular: to judge whether a price move carries "conviction." A price rise unaccompanied by volume is suspect in the eyes of professional traders. A widely circulated rule of thumb states: a market move without strong volume support cannot be considered valid.
This has an intrinsic connection to the A4 analogy. A single sheet is thin; its "bulk" is nearly negligible. But when you stack the thin slices of volume one by one, the thickness of the trend becomes visible. A single day's volume is like one sheet; a trend is a stack.
Volume-Price Divergence: The Most Important Signal
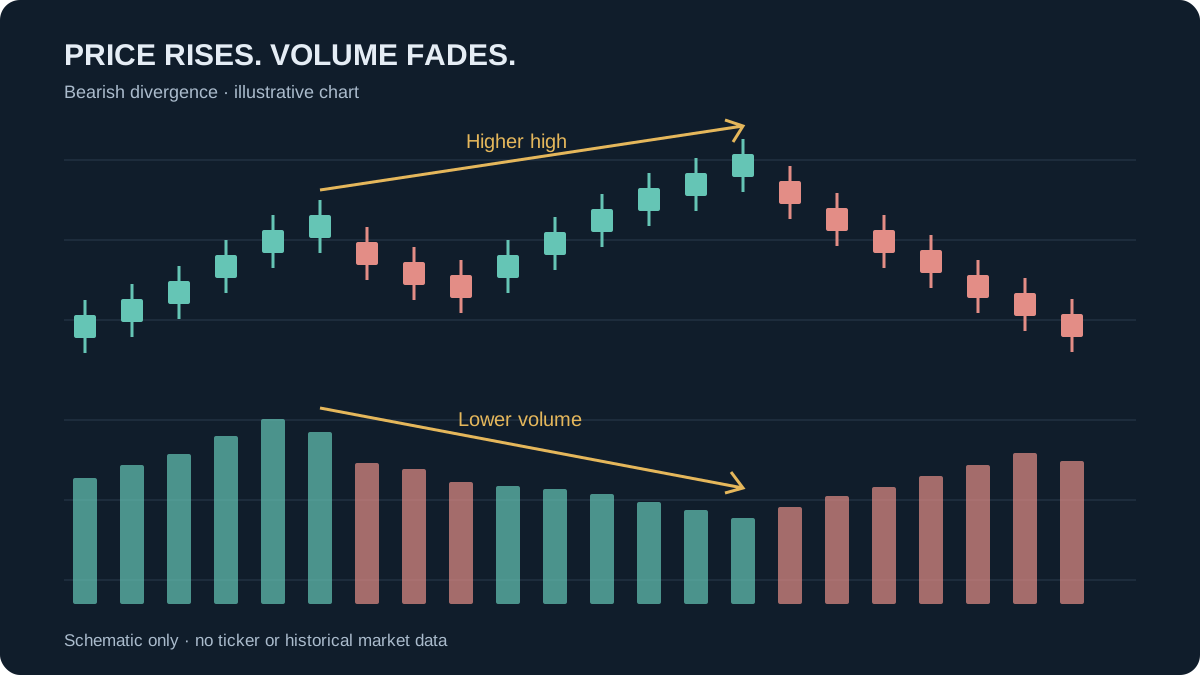
The most valuable part of volume analysis is not the size of volume itself, but the consistency or divergence between it and price behavior.
A repeatedly validated rule is: price rising while volume falling is an unfailing bearish signal; likewise, volume rising while price falling is also bearish. These two sentences deserve repeated reading. They describe the exhaustion of internal market momentum—when price is still moving in one direction, but the participants pushing it are decreasing or opposing forces are strengthening, the foundation of the trend is already loosening.
The Volume Oscillator is one tool for observing this divergence. It calculates the difference between two volume moving averages (e.g., 5-period and 20-period), displayed as a histogram above and below the zero line. Positive values mean market support is sufficient to sustain the current trend direction; negative values suggest insufficient support, and price may stall or reverse.
Volume in Downtrends: How Bottoms Form
Volume's role in identifying bottoms is particularly subtle. The end of a downtrend usually appears in one of two ways:
The first is panic selling. Volume reaches three to five times the average daily volume, persisting for multiple trading days. This high-volume decline creates a buyer imbalance—because intense selling pressure exhausts the supply of new sellers, and buyers begin to gain the advantage.
The second is volume exhaustion. Price continues to fall, but volume shrinks far below average, persisting for weeks or even months. This looks weaker, but actually means sellers have left the field, and value buyers are quietly building positions.
The second scenario has a counterintuitive feature: an instrument in a low-volume decline often takes longer to form a durable bottom than one in a panic crash. It is like an A4 sheet being slowly soaked—it won't tear immediately, but the structure is continuously weakening until some critical point.
Price by Volume: Putting Volume on the Price Axis
Conventional volume histograms sit on the time axis, answering "when was trading happening." But the Price by Volume (PBV) chart remaps volume onto the price axis, answering "at what price levels did trading occur."
In a PBV chart, the length of horizontal bars represents shares traded at the corresponding price level, with color distinguishing buying and selling pressure. Long bars mean significant trading interest at that level, often constituting support or resistance. When price later returns to these high-volume levels, the probability of a reaction is higher.
This is a more practical use than time-axis volume. The time axis tells you "volume expanded today"; the price axis tells you "at which price the expansion occurred"—the latter is the information trading decisions require.
Back to That A4 Sheet
An A4 sheet has an area of about 0.0624 m², a thickness of about 0.1 mm, and a single-sheet volume of about 6,237 mm³. That bulk is so small it is nearly negligible. But stack 500 of them, and you have an object with thickness.

Volume analysis works the same way. A single day's volume number, viewed in isolation, has limited meaning. Its value lies in comparison—against the past 20 days, against the platform before a breakout, against the magnitude of the price move. When price makes a new high but volume cannot exceed the volume corresponding to the previous high, divergence is telling you: this stack is thinner than the last one.
Technical analysis promises no certainty. Volume does not give an answer of "must rise" or "must fall," but a basis for adjusting probability weights. It reminds you: when price has traveled far on thin volume, the ground beneath may be more fragile than it appears.
Risk Disclosure: The above content is a discussion of technical analysis methods only and does not constitute any investment advice. Volume indicators carry lag and the possibility of misjudgment; no single indicator should be the sole basis for trading decisions. Markets carry risk; decisions must be independent.