Technical Analysis
Trendlines: Drawing a Line Around Behavior
A trendline is a straight line drawn on a price chart that connects a series of lows in an uptrend or a series of highs in a downtrend. The line is extended forward, and price is said to be respecting the line when it stays above it (in an uptrend) or below it (in a downtrend). The concept is simple, and the practice is more subjective than most traders admit.
The subjectivity is not a flaw to be eliminated. It is a feature of the tool. Different traders draw different lines because they select different points, and the selection is a judgment about which points are significant. The judgment is the analysis. The line is just a visualization of it.
What a Trendline Actually Describes
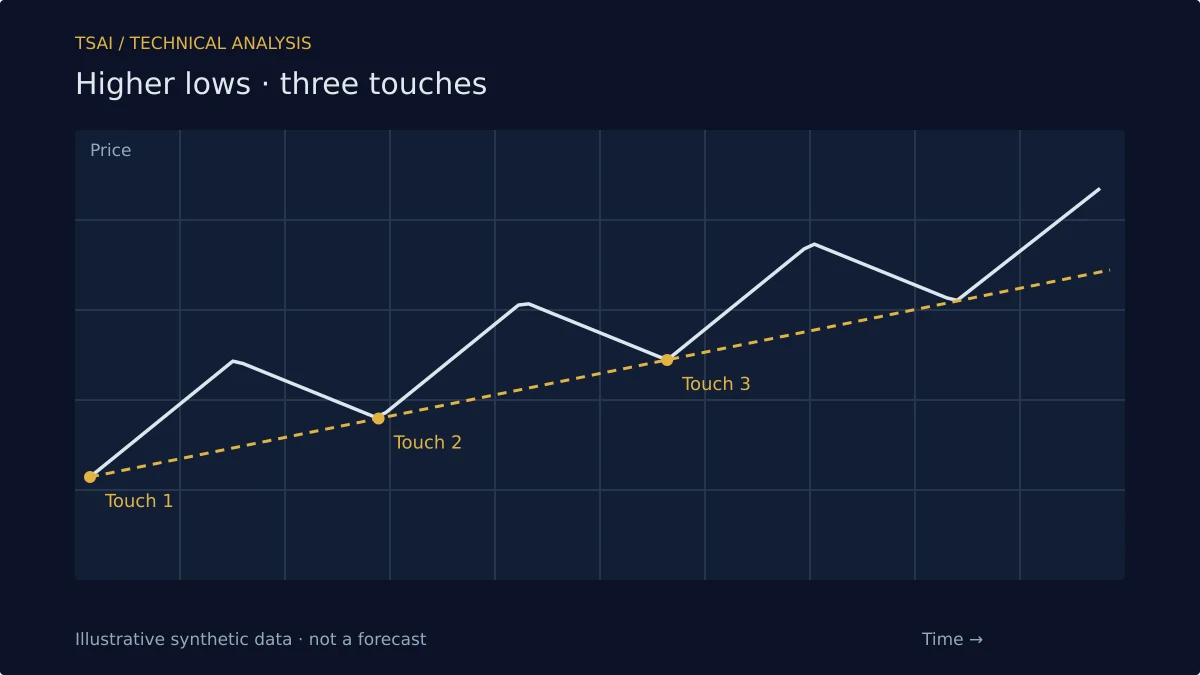
A trendline describes a pattern in the sequence of swing lows or swing highs. In an uptrend, the line connects lows that are successively higher, and the slope of the line is a summary of how quickly the trend is rising. In a downtrend, the line connects highs that are successively lower, and the slope summarizes how quickly the trend is falling.
The line is not a prediction. It is a description of the pattern, extended forward as a hypothesis: if the pattern continues, price will tend to find support near the line. The hypothesis may be wrong. The line does not make it right; it just makes it explicit.
Drawing Rules and Their Limits
A common rule is that a trendline requires at least two points to draw and a third point to confirm. The rule is reasonable—two points define a line, but any two points define a line, so the confirmation of a third touch is what makes the line meaningful. A line that has been touched three times is more likely to describe a real pattern than a line drawn through two arbitrary points.
The rule has limits. A third touch confirms the line, but it also creates a situation where the next touch is a test: either the line holds and the pattern continues, or it breaks and the pattern changes. The confirmation and the vulnerability arrive together.
The Angle Problem
The slope of a trendline is a function of the chart's aspect ratio. A line that looks steep on a chart with a compressed time axis looks shallow on a chart with an expanded one. This is not a minor issue; it means that two traders looking at the same price data can draw lines with different slopes and both be technically correct.
The practical response is to be consistent. Use the same chart settings, the same timeframe, and the same selection criteria. The consistency does not make the line objective, but it makes it reproducible, which is the next best thing.
Trendlines and Regime Change
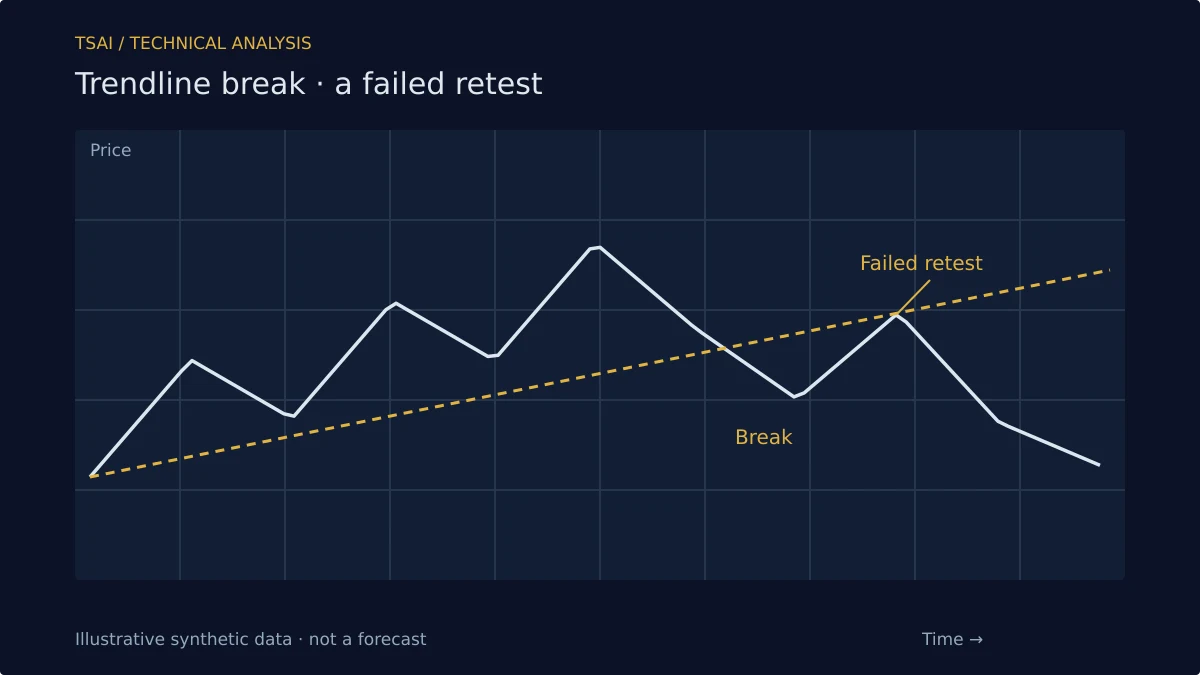
The most useful signal from a trendline is the break. A break of an uptrend line describes a change in the pattern of higher lows. It does not say the trend is over; it says the specific pattern that defined the trend has ended. The market may form a new pattern, or it may reverse. The break is a change in the description, not a prediction of the outcome.
This is why trendline breaks are best read alongside other evidence. A break with volume expansion and a failed retest is more meaningful than a break on light volume with no follow-through. The line is one input; the read is the synthesis.
What Trendlines Do Not Do
They do not predict where price will go. They do not work because of any geometric law. They describe a pattern in the sequence of swing points, and they make that description visible. Used as a frame for reading trend structure and as a reference for breaks, they are useful. Used as precise prediction tools, they will mislead as often as they inform.
Risk Disclosure: The above content is a discussion of technical analysis methods only and does not constitute any investment advice. Trendlines are subjective and carry no predictive guarantee; no single tool should be the sole basis for trading decisions. Markets carry risk; decisions must be independent.