Technical Analysis
Double Tops and Bottoms: A Failure to Extend
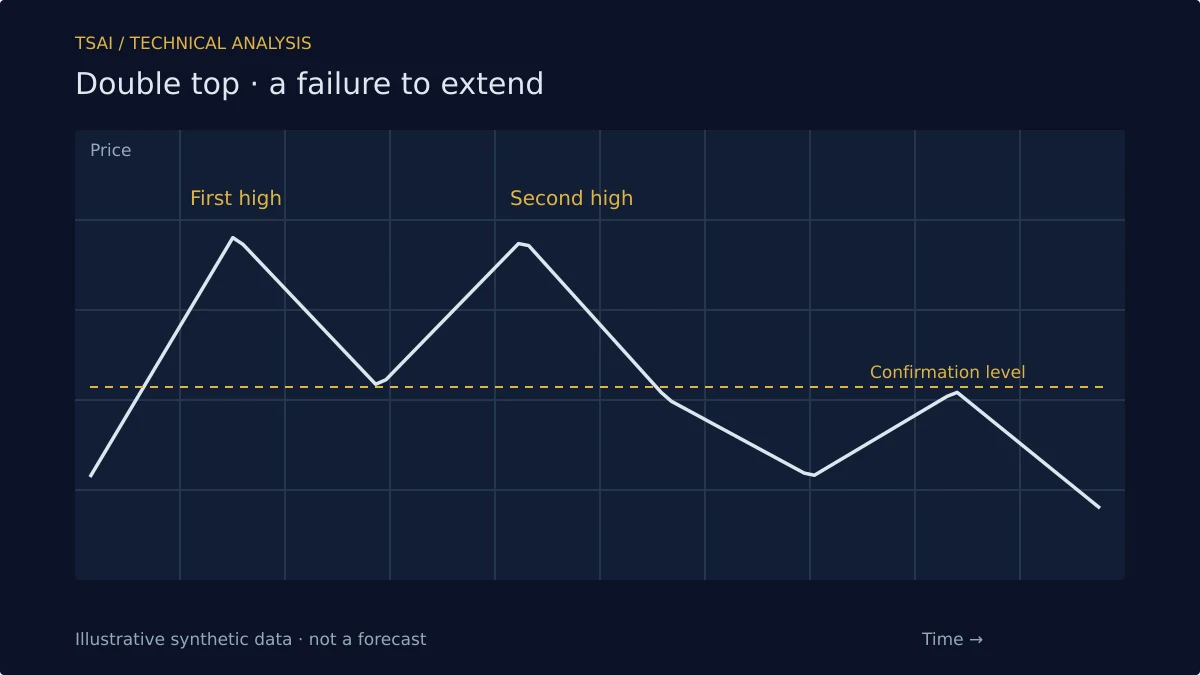
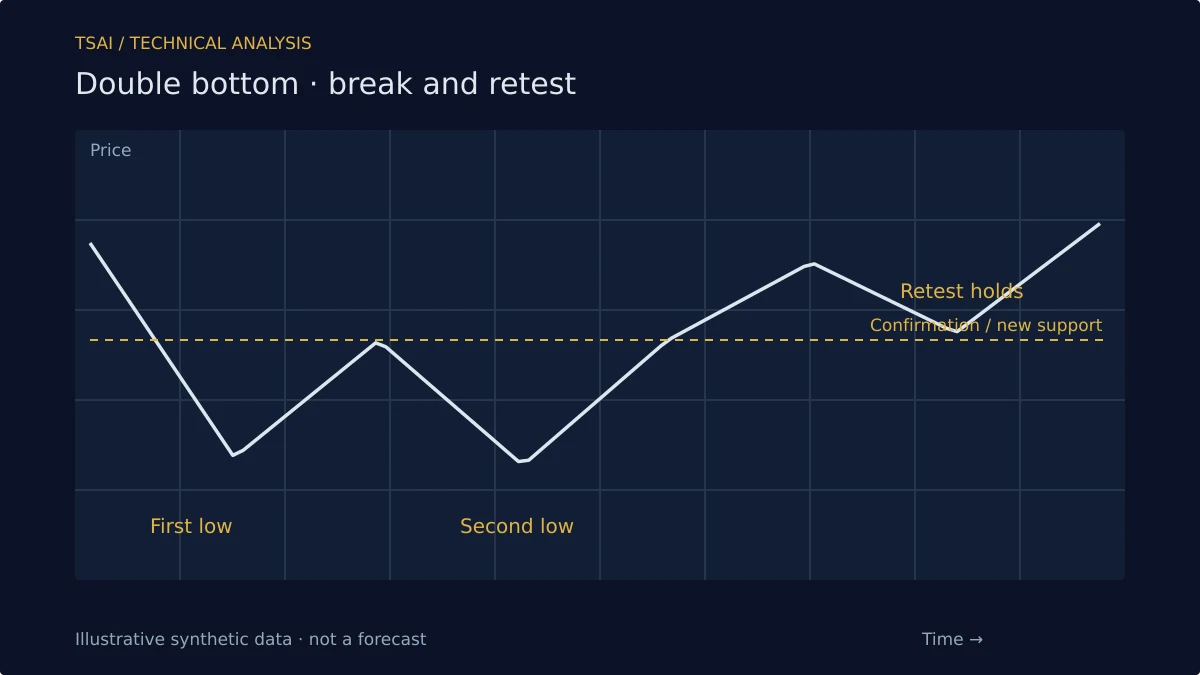
A double top is a pattern in which price makes two successive highs at approximately the same level, with a trough between them. A double bottom is the inverse: two successive lows at approximately the same level, with a peak between them. The pattern is completed when price breaks the level of the intervening trough (for a top) or peak (for a bottom).
The structure is simpler than head and shoulders, and that simplicity is both its appeal and its limitation. It is easy to see, which means it is easy to over-identify. Many chart formations that look like double tops are simply consolidations, and many that look like double bottoms are pauses in a downtrend.
The Failure to Extend
The core of the pattern is a failure to extend. In a double top, price reaches a high, pulls back, then returns to the same high but cannot exceed it. The second attempt at the high is the test. The failure to make a new high on the second attempt is the signal that the buyers who drove the first high are no longer able to drive a second, higher one.
This is the same logic as head and shoulders, but compressed. Head and shoulders has three attempts; double top has two. The compression makes the pattern more frequent and less reliable, because two attempts are weaker evidence than three.
Confirmation and the Neckline
The confirmation level is the trough between the two highs (for a top) or the peak between the two lows (for a bottom). A break of this level is the conventional confirmation. Without the break, the pattern is a hypothesis, not a signal.
The break is often followed by a retest of the confirmation level from the other side. A failed retest strengthens the signal; a successful retest weakens it. The retest is the market's second chance to reject the break, and the outcome is informative.
Symmetry and Tolerance
The two highs in a double top are rarely identical. A tolerance is needed, and the tolerance should reflect the volatility of the instrument. A double top with highs that differ by 0.1% is a tighter pattern than one with highs that differ by 1%, but both can be valid depending on context.
The tolerance also applies to the time between the highs. A double top that forms over days is different from one that forms over months. The shorter the time between the highs, the more the pattern is a consolidation; the longer the time, the more it is a distribution.
The Target and Its Limits
The conventional target for a double top is the height of the pattern, measured from the highs to the confirmation level, projected downward from the confirmation level. The target is a convention, not a prediction. It provides a reference, not a guarantee.
The target's usefulness is in assessing whether the pattern's logic is being followed. A double top that breaks the confirmation level and reaches the target is behaving as the pattern would suggest. One that breaks and stalls is not, and the failure is information.
What the Pattern Does Not Do
It does not predict that the trend will reverse. It describes a failure to extend, which is evidence that the balance of buyers and sellers may be shifting. The pattern is a description of a process, not a forecast of its outcome. Used as a frame for reading exhaustion, it is useful. Used as a mechanical reversal signal, it will be wrong often enough to be costly, particularly in strong trends where the pattern is a pause rather than a top.
Risk Disclosure: The above content is a discussion of technical analysis methods only and does not constitute any investment advice. Chart patterns carry no predictive guarantee; no single pattern should be the sole basis for trading decisions. Markets carry risk; decisions must be independent.