Technical Analysis
Head and Shoulders: A Pattern of Distribution
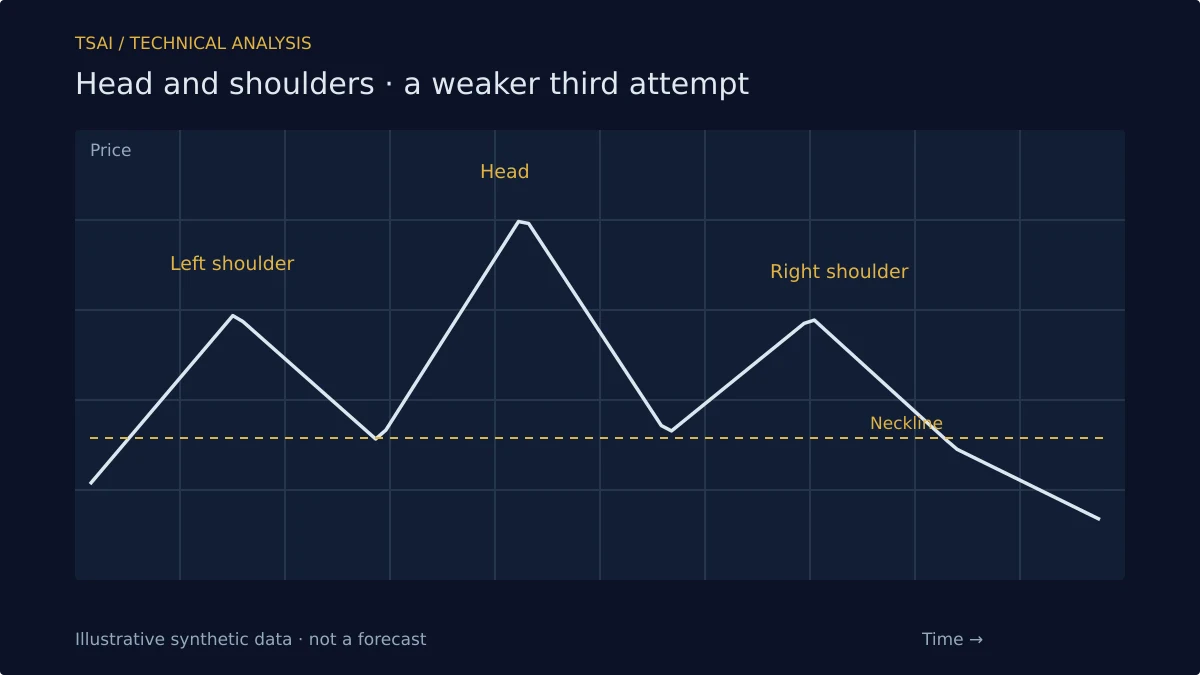
The head and shoulders pattern is one of the oldest chart patterns in technical analysis, and one of the most discussed. It consists of three peaks: a left shoulder, a higher head, and a right shoulder that is roughly the same height as the left. The pattern is completed when price breaks below the neckline, a line drawn through the lows between the shoulders and the head. The inverse pattern, with troughs instead of peaks, is a head and shoulders bottom.
The pattern is a description of a shift in the balance of power. In the topping version, buyers push price to a high (left shoulder), then to a higher high (head), then fail to reach the previous high (right shoulder). The failure to make a new high on the third attempt is the key feature: the buyers who drove the first two advances are no longer able to do so.
The Structure and Why It Matters
The left shoulder represents the last strong advance of the trend. The head represents a final push that attracts buyers but does not sustain. The right shoulder represents a weaker advance that fails to reach the head. The neckline connects the lows between these peaks, and its break is the confirmation that the pattern is complete.
The structure matters because it describes a sequence of weakening attempts. Each peak is a test of whether buyers can push price higher. The first succeeds, the second succeeds more, the third fails. The sequence is the signal; the shape is the visualization.
The Neckline and Confirmation
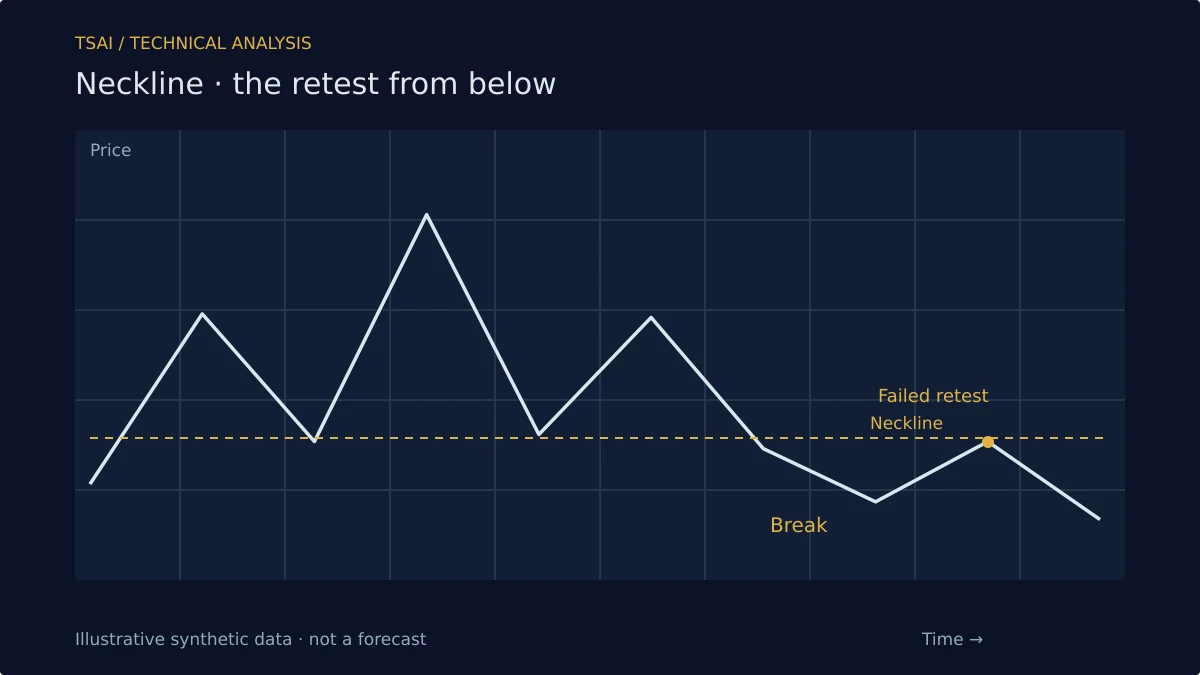
The neckline is the line drawn through the lows between the shoulders and the head. It is often slightly sloped, which makes the exact break point a judgment call. A break below the neckline is the conventional confirmation of the pattern.
The confirmation is not the end of the analysis; it is the beginning. A head and shoulders pattern that breaks the neckline and then retests it from below, failing to reclaim it, is a stronger signal than one that breaks and immediately reverses. The retest says the market had a chance to reject the break and did not.
Volume and the Pattern
Volume is often cited as a confirming feature of the pattern. In the classic description, volume is highest during the left shoulder and the head, and lower during the right shoulder. The decline in volume is consistent with the weakening of buying pressure that the pattern describes. The neckline break is often accompanied by an increase in volume, which supports the interpretation that the break is genuine.
The volume signature is not a requirement. Patterns can form without it, and the absence of the signature does not invalidate the pattern. But the signature, when present, strengthens the read.
Measuring and Targets
The conventional target for a head and shoulders pattern is the height of the head above the neckline, projected downward from the neckline break. The target is a convention, not a prediction. It provides a reference for where the pattern's logic would suggest price might go, based on the assumption that the pattern's structure repeats at a similar scale.
The target should be treated as a hypothesis, not a promise. Many head and shoulders patterns reach their targets; many do not. The target is useful as a planning tool and as a way to assess whether a move is behaving as the pattern would suggest.
What the Pattern Does Not Do
It does not predict that the trend will reverse. It describes a sequence of weakening attempts to make new highs, and it suggests that the balance of buyers and sellers has shifted. The pattern is a description of a process, not a forecast of its outcome. Used as a frame for reading distribution, it is one of the more informative classical patterns. Used as a mechanical reversal signal, it will produce false positives, particularly in strong trends where the pattern is a consolidation rather than a top.
Risk Disclosure: The above content is a discussion of technical analysis methods only and does not constitute any investment advice. Chart patterns carry no predictive guarantee; no single pattern should be the sole basis for trading decisions. Markets carry risk; decisions must be independent.