Technical Analysis
Support and Resistance: The Memory of Price
Support and resistance are the most intuitive concepts in technical analysis and the most easily misused. A support level is a price at which buying has previously been strong enough to stop a decline. A resistance level is a price at which selling has previously been strong enough to stop an advance. The definitions are simple. The application is not.
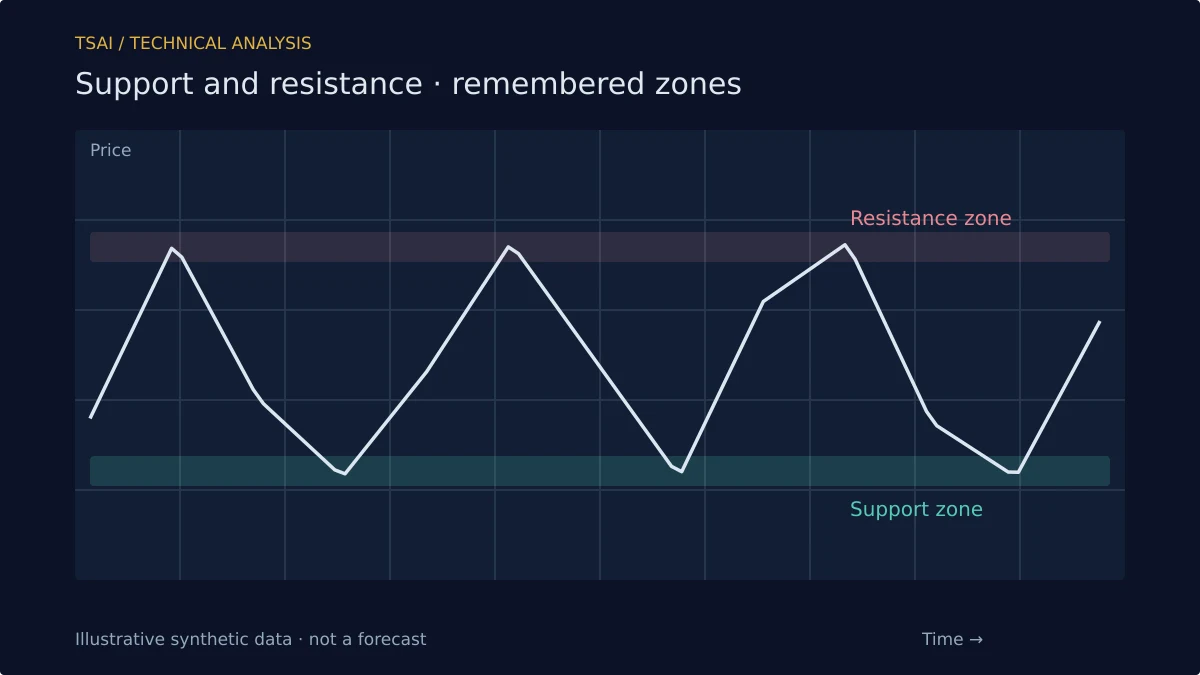
The core idea is that price has memory. When price has traded at a level before, participants who acted there remember it. Buyers who bought at support remember the level as a place where they were rewarded. Sellers who sold at resistance remember it as a place where they were vindicated. When price returns, those memories shape behavior.
Why Levels Form
There are several mechanisms. The first is order flow: limit orders cluster at prices where participants have previously transacted. The second is psychology: a price at which a trader was stopped out becomes a price they want to revisit, either to re-enter or to avoid a repeat. The third is anchoring: round numbers and previous highs and lows are salient, and salience attracts attention.
The mechanisms are not mutually exclusive, and they do not all point to the same level. A previous swing high, a round number, and a moving average can all be relevant at slightly different prices. The levels are not precise because the mechanisms that create them are not precise.
Zones, Not Lines
The most common error is to treat support and resistance as lines. A support level that holds at 99.80 has not failed because price briefly trades at 99.70 and then recovers. The level is a zone, and the width of the zone should reflect the volatility of the instrument and the timeframe being traded. On a daily chart of a volatile stock, a zone of a few percent is not unreasonable.
Treating levels as zones also resolves the apparent contradiction between "price bounced exactly at support" and "price broke through support and then reversed." In a zone framework, both are consistent: price traded into the zone and found buyers, or traded through the zone and failed to find them.
Breaks and Retests
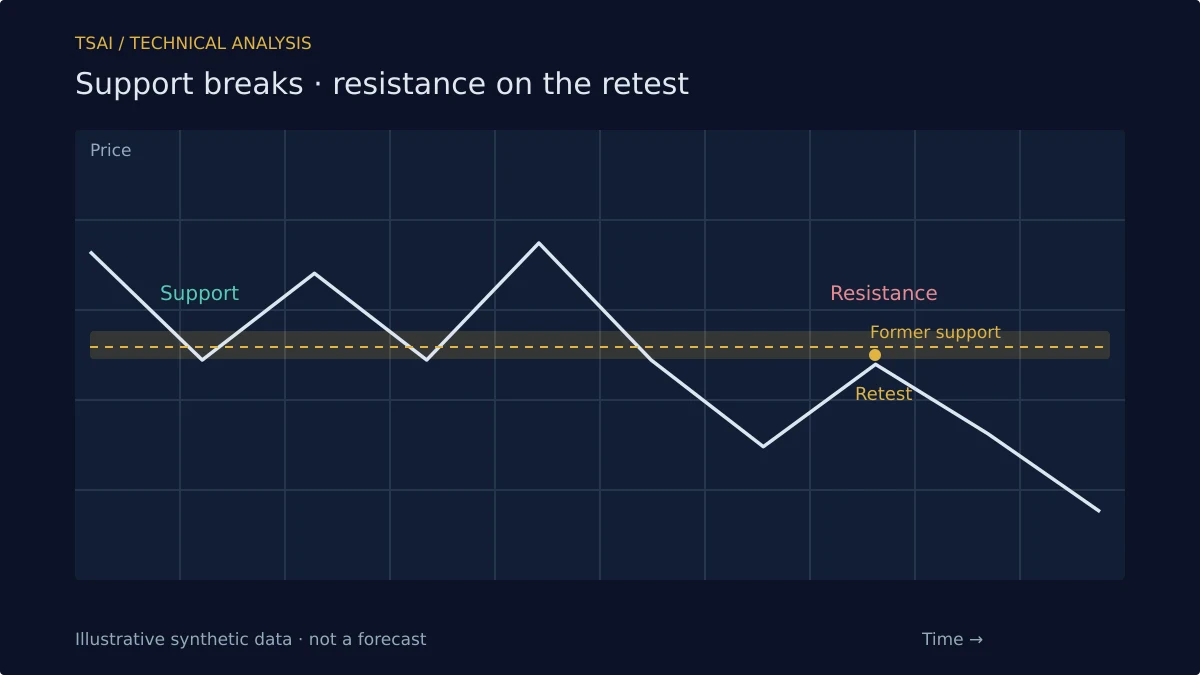
When support breaks, it often becomes resistance, and vice versa. The mechanism is the same memory: participants who bought at support and are now underwater sell when price returns to the level, creating resistance where support used to be. The role reversal is not a law, but it is common enough to be a useful default.
The retest is the confirmation. A break of support that is followed by a retest that fails to reclaim the level is a stronger signal than a break that is not tested. The retest says that the market had an opportunity to reject the break and did not. That is more informative than the break alone.
False Breaks and Liquidity
Not every break is real. A break of support can be a liquidity event—a large order sweeping stops—rather than a genuine change in the balance of buyers and sellers. The market often recovers quickly from such breaks, which is why false breaks are a recognized pattern.
The practical response is to require confirmation before acting on a break. A close beyond the level, a retest that fails, or a volume signature that is consistent with genuine participation are all ways to filter false breaks. The filter reduces the number of signals, but it improves their quality.
Levels in Trends and Ranges
In a range, support and resistance define the range, and the levels are the basis for mean-reversion trades. In a trend, the levels are the basis for pullback entries: a retracement to a previous support or resistance level in the direction of the trend is a lower-risk entry than a chase.
The same level can be relevant in both regimes, but the response is different. In a range, a touch of resistance is a sell. In a trend, a touch of resistance that is part of a pullback in an uptrend is a potential continuation. The level is the same; the interpretation depends on the regime.
What Support and Resistance Do Not Do
They do not predict when price will reverse. They do not identify the end of a trend. They do not work because of any mathematical law. They work because participants remember, and memory shapes behavior. Used as zones for entry, exit, and confirmation, they are among the most useful concepts in technical analysis. Used as precise prediction tools, they will fail as often as they succeed.
Risk Disclosure: The above content is a discussion of technical analysis methods only and does not constitute any investment advice. Support and resistance levels carry no predictive guarantee; no single tool should be the sole basis for trading decisions. Markets carry risk; decisions must be independent.