Technical Analysis
Rounding Bottom: A Slow Transition
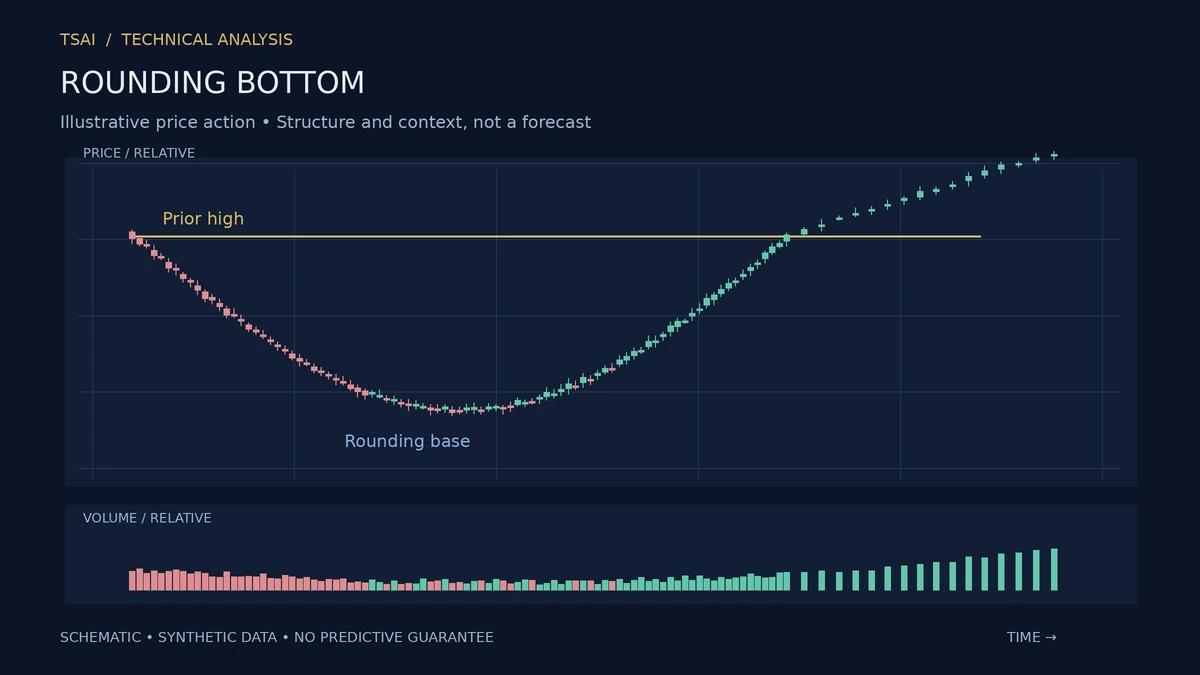
A rounding bottom is a chart pattern in which price forms a U-shaped decline and recovery over an extended period. The pattern is sometimes called a saucer, and it is the base component of the cup and handle. The distinguishing feature is the gradual nature of the transition: the decline slows, the bottom forms, and the recovery accelerates.
The pattern is often overlooked because it is slow and lacks the sharp features of other classical patterns. But the slowness is the point. A rounding bottom describes a transition from selling to buying that develops over time, which is more consistent with a durable bottom than a sharp reversal.
The Gradual Transition
The decline in a rounding bottom is gradual, often with declining volume. The bottom itself is flat, with low volatility and low volume. The recovery is gradual, with rising volume. The shape is a smooth curve, not a V.
The gradual transition is the pattern's strength. A V-shaped bottom is often driven by a single event—a news release, a policy change—and it can reverse as quickly as it formed. A rounding bottom is driven by a change in the balance of buyers and sellers over time, which is more durable.
Volume and the Pattern
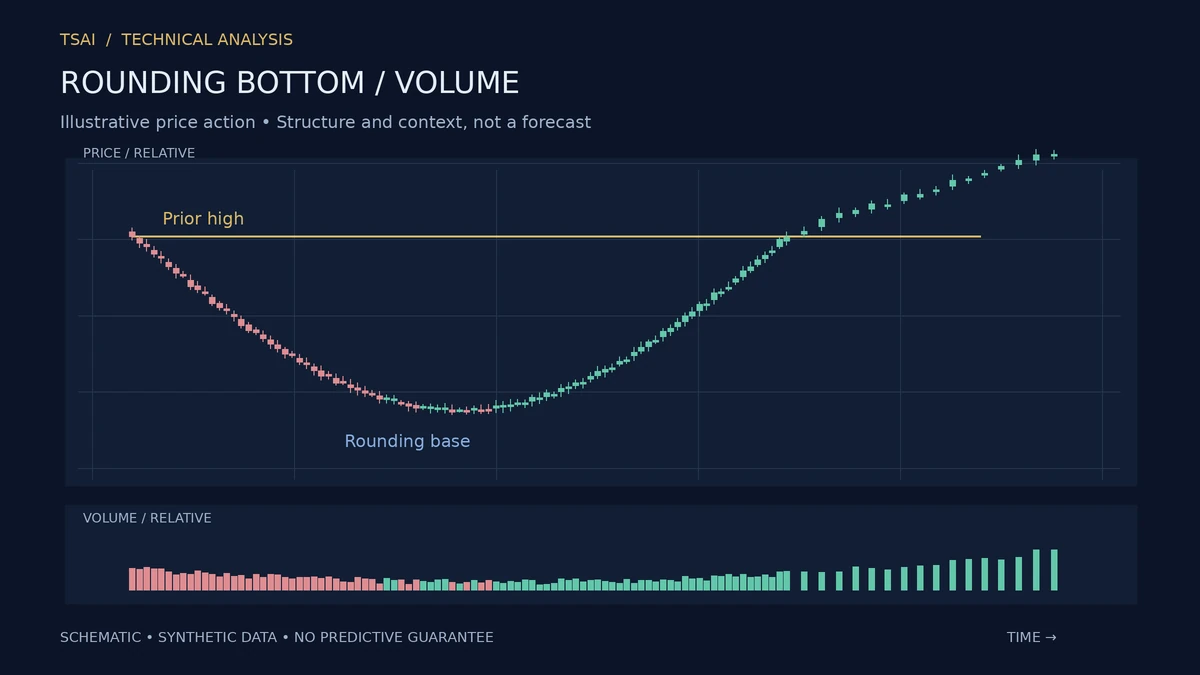
The volume signature of a rounding bottom is a decline during the decline, a trough at the bottom, and an increase during the recovery. The volume signature is consistent with the gradual transition: as the decline slows, fewer participants find the price attractive; as the recovery begins, more participants find it attractive.
The volume signature is not a requirement, but its presence strengthens the read.
The Breakout
The pattern is completed when price breaks above the level of the prior high—the start of the decline. The breakout is the confirmation, often accompanied by an increase in volume.
The conventional target is the depth of the pattern, projected from the breakout. The target is a convention, not a prediction.
What the Pattern Does Not Do
It does not predict the size or timing of the recovery. It does not work because of any geometric law. It describes a gradual transition from selling to buying, and it makes the transition visible. Used as a base for a bullish move, it is one of the more reliable classical patterns. Used as a guarantee, it will fail often enough to be costly.
Risk Disclosure: The above content is a discussion of technical analysis methods only and does not constitute any investment advice. Chart patterns carry no predictive guarantee; no single pattern should be the sole basis for trading decisions. Markets carry risk; decisions must be independent.