Technical Analysis
Rectangle Formation: A Range With Edges
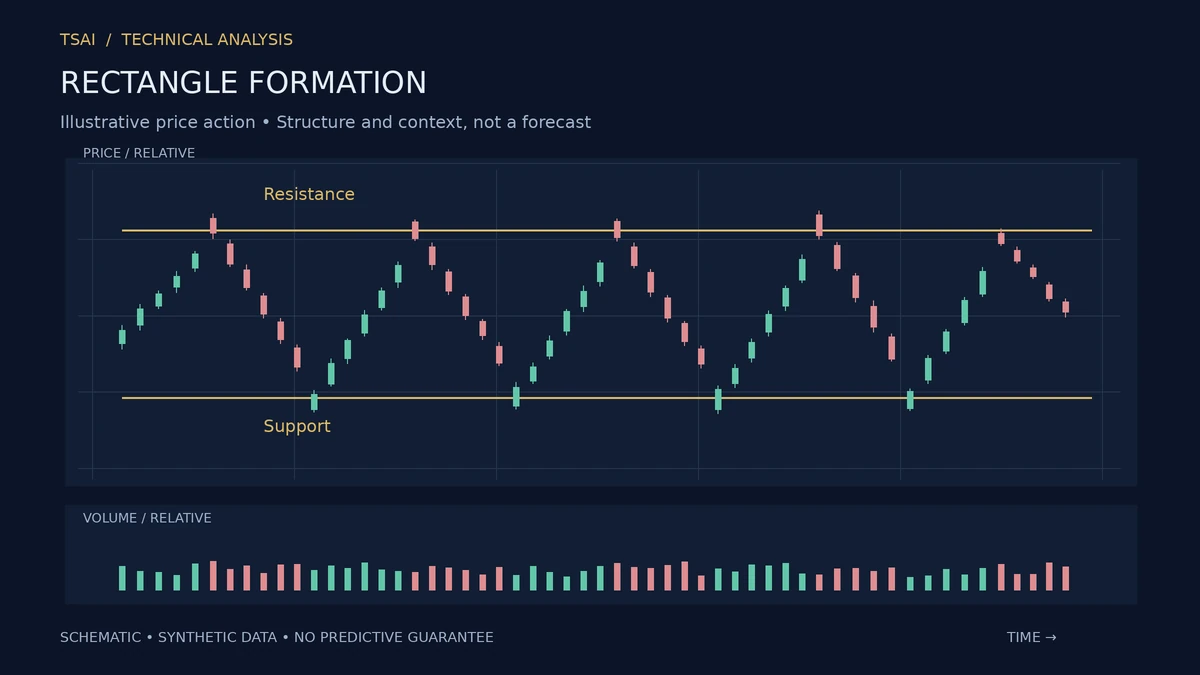
A rectangle formation is a chart pattern in which price oscillates between horizontal support and resistance lines. The upper line is a fixed resistance; the lower line is a fixed support. The pattern is a range, and the range is the point: it describes a balance between buyers and sellers, with neither side able to push price beyond the boundaries.
The pattern is one of the simplest in technical analysis, and its simplicity is both its appeal and its limitation. It is easy to see, which means it is easy to over-identify. Many consolidations that look like rectangles are simply pauses in a trend, and many that look like rectangles are wider patterns in disguise.
The Edges as Information
The edges of the rectangle are the levels where the balance is tested. A touch of the upper line is a test of whether buyers can push through; a touch of the lower line is a test of whether sellers can. The edges are not predictions; they are levels where the balance is visible.
The number of touches matters. A rectangle with multiple touches on both sides is a more established balance than one with only one or two. The established balance is more likely to resolve decisively when it breaks.
The Breakout
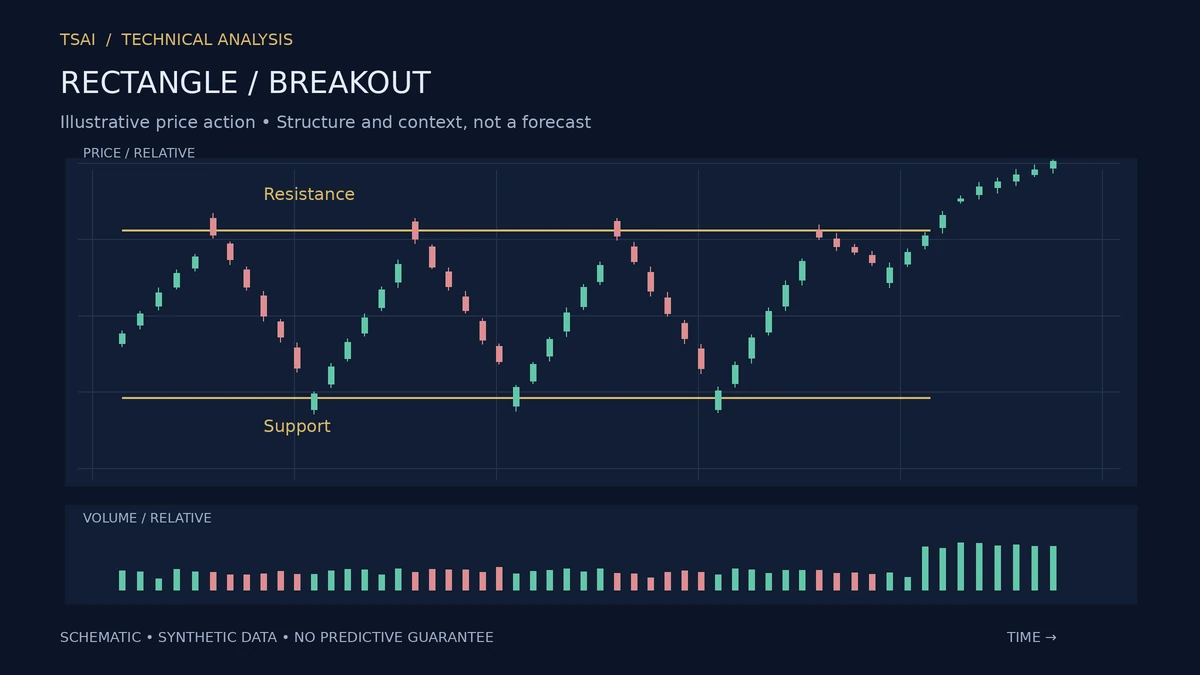
The pattern is completed when price breaks decisively above the upper line or below the lower line. The breakout is the confirmation of the resolution of the balance. The direction of the breakout is not determined by the pattern; it is determined by which side wins the test.
The breakout is often accompanied by an increase in volume. The volume expansion is the signature of genuine participation.
The Target
The conventional target for a rectangle is the height of the range, projected from the breakout. The target is a convention, not a prediction.
The Failure Mode
The most common failure mode is a breakout that fails and returns to the range. The failure is informative: the market had a chance to resolve and did not. The failure is often a more significant signal than the original pattern.
What the Pattern Does Not Do
It does not predict the direction of the breakout. It does not work because of any geometric law. It describes a balance between buyers and sellers, and it makes the boundaries of that balance visible. Used as a setup for breakouts, it is useful. Used as a prediction, it will mislead.
Risk Disclosure: The above content is a discussion of technical analysis methods only and does not constitute any investment advice. Chart patterns carry no predictive guarantee; no single pattern should be the sole basis for trading decisions. Markets carry risk; decisions must be independent.