Technical Analysis
Broadening Formation: Expanding Boundaries
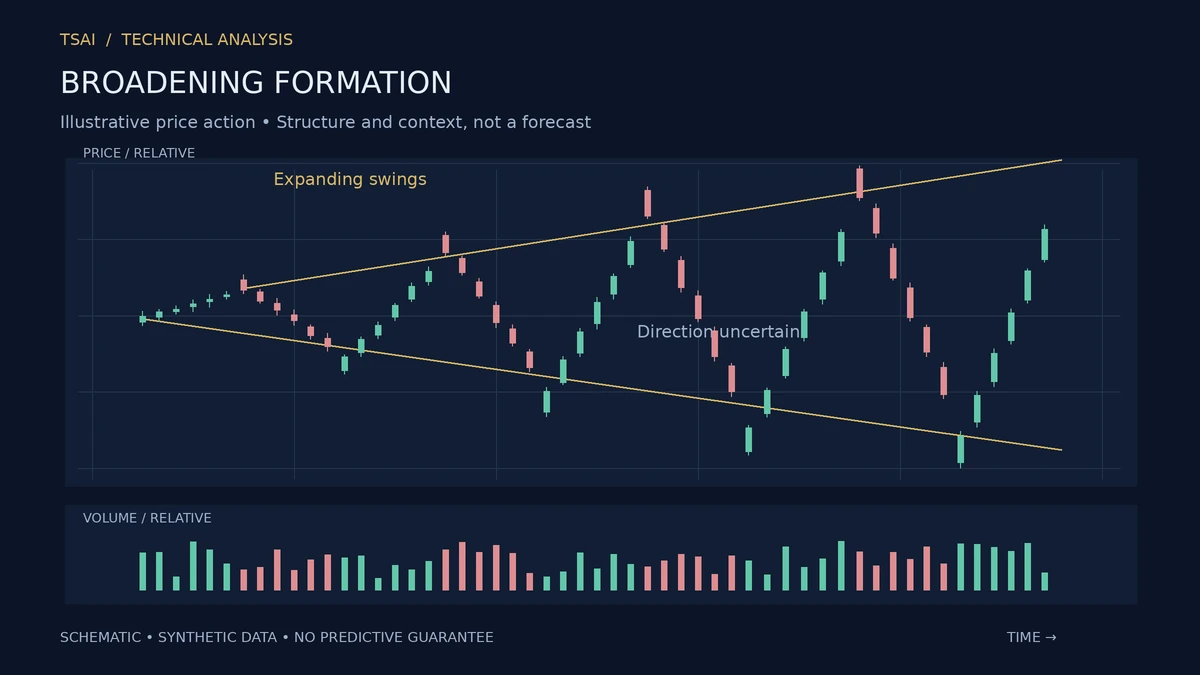
A broadening formation is the opposite of a triangle. Where a triangle has converging lines, a broadening formation has diverging lines. The upper line rises and the lower line falls, so the range widens over time. The pattern is sometimes called a megaphone, and it is one of the less common classical patterns.
The pattern describes increasing volatility. The range is expanding, which means the size of the price swings is increasing. The expansion is the point: it describes a market that is becoming more unstable, not less.
The Directional Ambiguity
The broadening formation is directionally ambiguous. The widening range can resolve in either direction, and the pattern does not specify which. The ambiguity is the pattern's defining feature: it describes instability without specifying the outcome.
The directional ambiguity makes the pattern less useful as a signal than as a description. It tells you the market is becoming unstable, but it does not tell you which way it will break.
The Volume Signature
The volume signature of a broadening formation is typically erratic. The volume is high on the swings and lower in between, which is consistent with the expanding range: each swing is a larger move, which attracts more attention.
The volume signature is not a strong confirmation, because the pattern itself is a description of instability rather than a directional bias.
The Distribution and Accumulation Readings
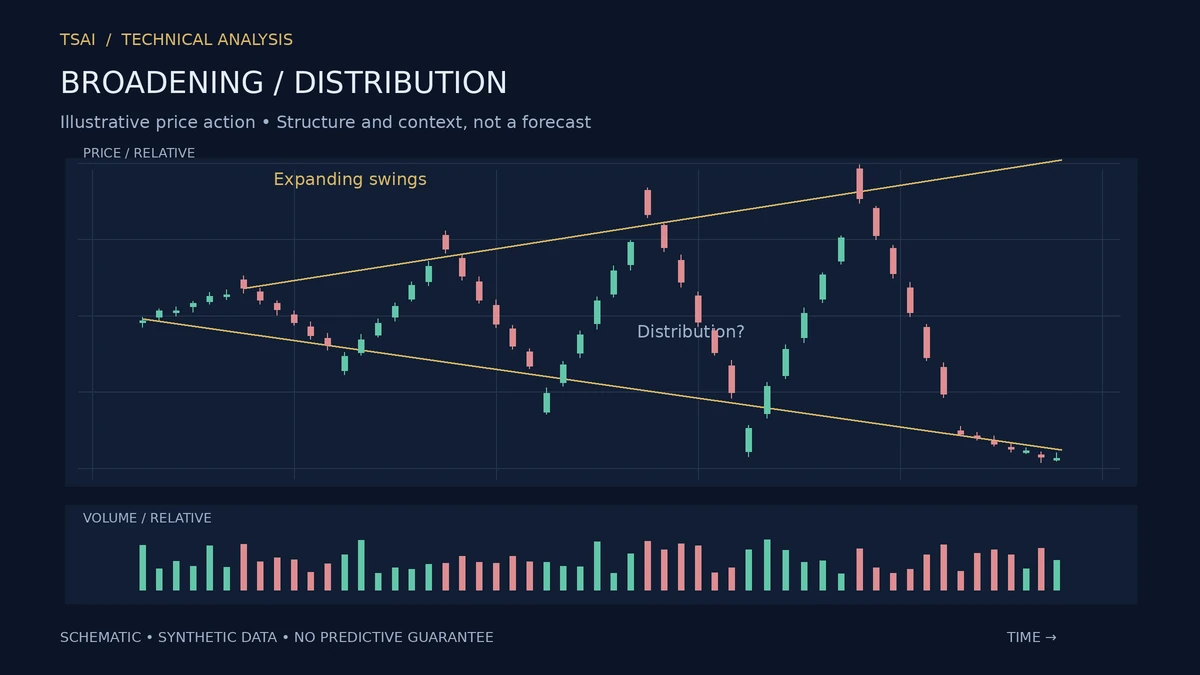
The broadening formation is often read as a sign of distribution at a top or accumulation at a bottom. The reading is based on the logic that a market that is becoming more volatile is a market where large participants are repositioning. The repositioning creates the swings, and the swings create the widening range.
The reading is a tendency, not a law. A broadening formation can resolve in either direction, and the distribution/accumulation reading is a hypothesis, not a prediction.
The Failure Mode
The most common failure mode is a pattern that looks like a broadening formation but is actually a series of independent swings. The distinction is the diverging lines: without them, the pattern is not a broadening formation.
What the Pattern Does Not Do
It does not predict the direction of the resolution. It does not work because of any geometric law. It describes an expanding range and the instability that the expansion represents. Used as a description of increasing volatility, it is useful. Used as a directional signal, it has nothing to say.
Risk Disclosure: The above content is a discussion of technical analysis methods only and does not constitute any investment advice. Chart patterns carry no predictive guarantee; no single pattern should be the sole basis for trading decisions. Markets carry risk; decisions must be independent.