Candlestick Patterns
Morning Star and Evening Star: A Three-Candle Reversal
The morning star and evening star are three-candle patterns that describe a transition in the balance of buyers and sellers. The morning star appears at the bottom of a downtrend; the evening star at the top of an uptrend. Both patterns consist of a large candle in the direction of the trend, a small candle that gaps away from the trend, and a large candle in the opposite direction.
The three-candle structure is the point. The first candle describes the trend; the second describes indecision; the third describes the reversal. The pattern is a description of a process, not a single event.
The Morning Star
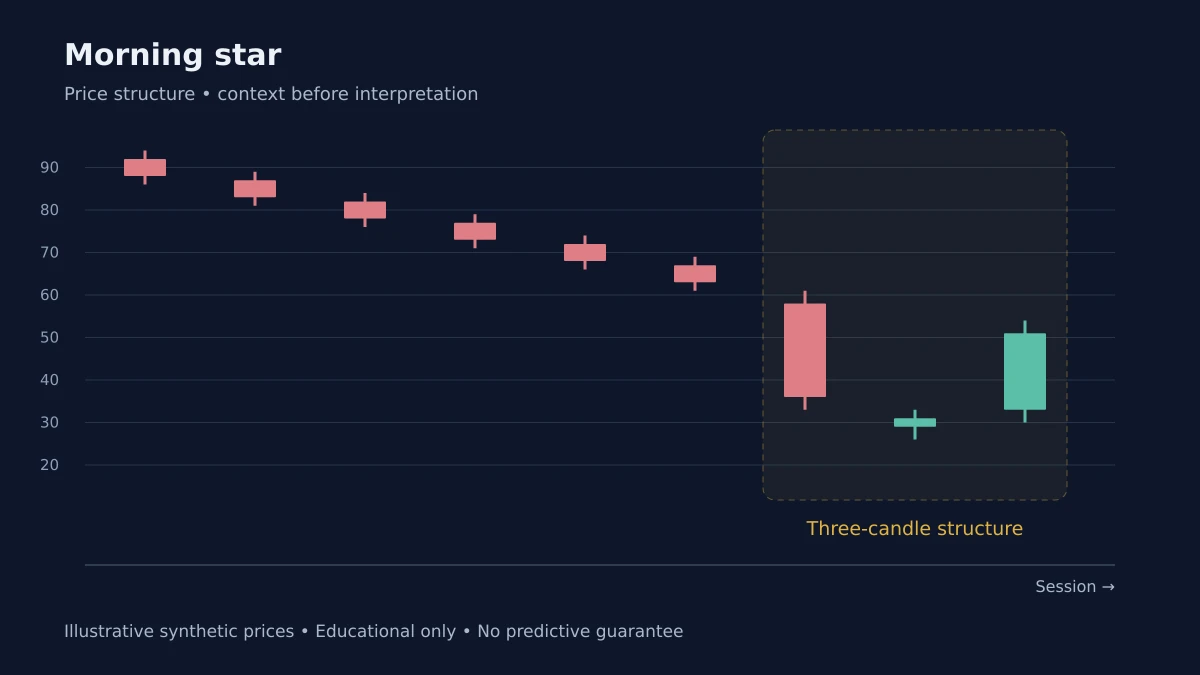
The morning star appears at the bottom of a downtrend. The first candle is a large red body, describing strong selling. The second candle is a small body (often a doji or a spinning top) that gaps below the first candle's close, describing indecision or a pause. The third candle is a large green body that closes well into the first candle's body, describing a reversal.
The pattern is more meaningful when the third candle closes above the midpoint of the first candle, and when the pattern appears after an extended decline.
The Evening Star
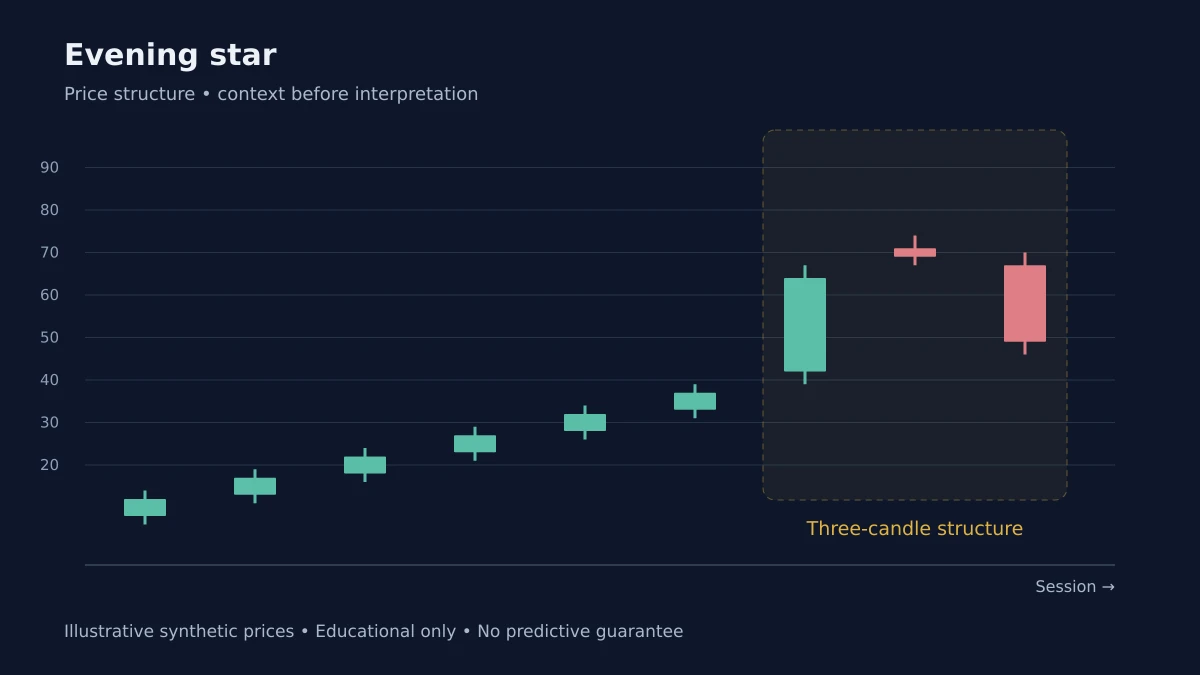
The evening star is the mirror image. The first candle is a large green body; the second is a small body that gaps above the first; the third is a large red body that closes well into the first candle's body.
The Gap
The gap between the first and second candle is a distinguishing feature. The gap describes a discontinuity: the second session opens away from the first's close, which is consistent with a shift in sentiment. In markets where gaps are common, the gap is a stronger feature; in markets where gaps are rare, the pattern can form without it.
The Confirmation
Neither pattern is a signal on its own. The confirmation comes from the following candle: a strong close in the direction of the third candle suggests the reversal is genuine; a weak close is a warning.
What These Patterns Do Not Do
They do not predict the size or timing of the reversal. They describe a three-candle transition, and they make the transition visible. Used with context and confirmation, they are among the more reliable candlestick patterns. Used as standalone signals, they will produce false positives.
Risk Disclosure: The above content is a discussion of technical analysis methods only and does not constitute any investment advice. Candlestick patterns carry no predictive guarantee; no single pattern should be the sole basis for trading decisions. Markets carry risk; decisions must be independent.