Candlestick Patterns
Doji: A Candlestick That Says Nothing Happened
A doji is a candlestick in which the open and close are approximately equal. The body is a horizontal line, or nearly so, and the wicks extend above and below. The shape is a cross, and the visual impression is that nothing happened during the period: price opened, moved, and returned to where it started.
The doji is one of the most discussed candlestick patterns, and one of the most over-interpreted. The pattern describes indecision, and indecision is a description, not a signal. The doji can appear at a top, a bottom, or the middle of a trend, and its meaning depends on context.
The Variants
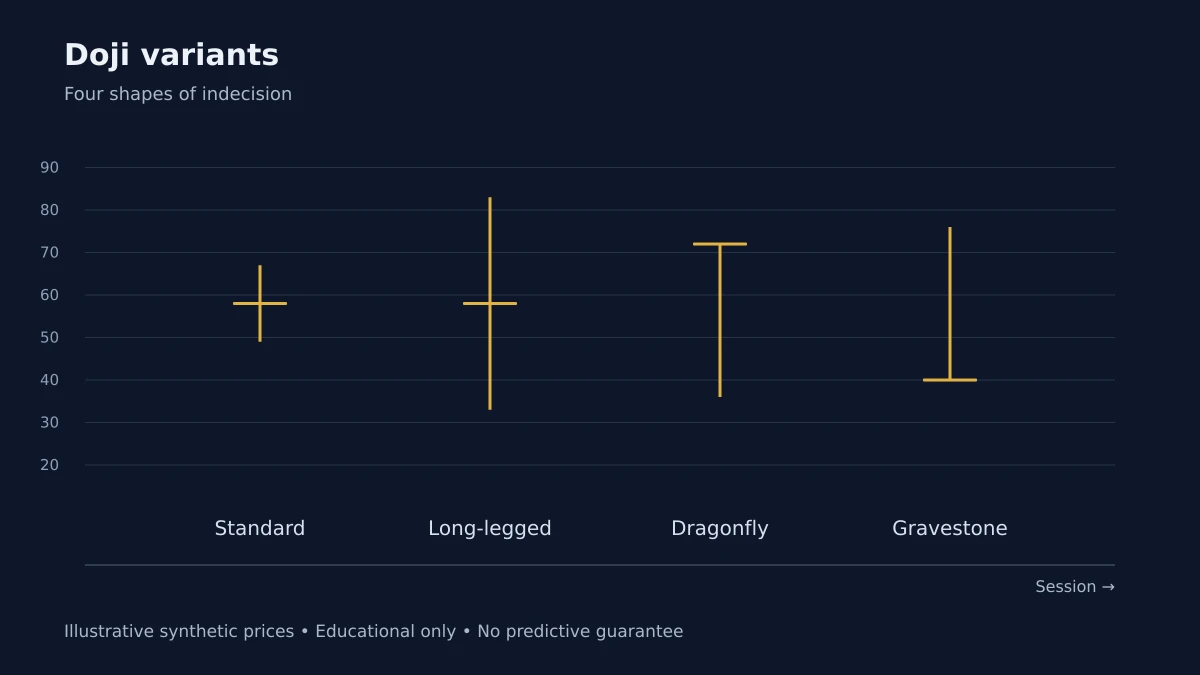
The doji comes in several variants, distinguished by the length and position of the wicks. The standard doji has wicks of roughly equal length. The long-legged doji has very long wicks on both sides, describing a session with a wide range and a close near the open. The dragonfly doji has a long lower wick and no upper wick, describing a session that sold off and recovered. The gravestone doji has a long upper wick and no lower wick, describing a session that rallied and faded.
The variants carry slightly different information. The dragonfly and gravestone dojis describe a directional attempt that failed; the long-legged doji describes a session with a wide range but no net movement.
The Context
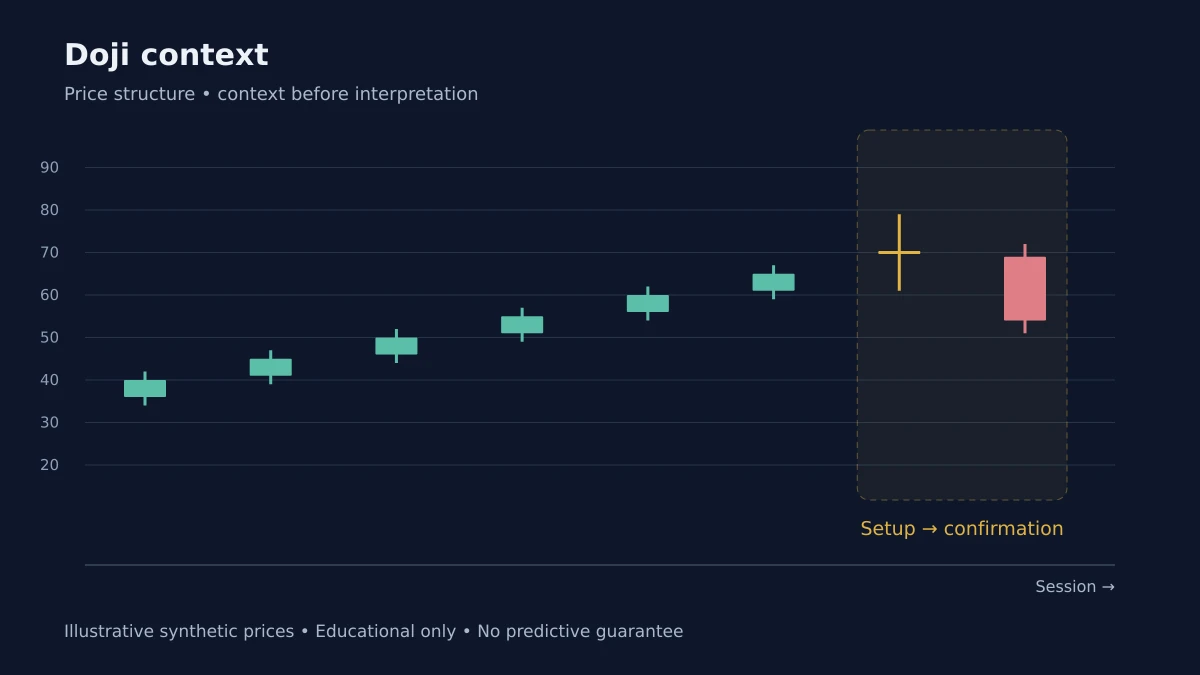
The doji is meaningful only in context. A doji at the top of a long uptrend can be a sign of indecision that precedes a reversal. A doji in the middle of a trend is often a pause. A doji in a range is often meaningless, because the market is already indecisive.
The context is the pattern's frame. A doji without context is a shape, not a signal.
The Confirmation
The doji is rarely a signal on its own. The confirmation comes from the following candle: a strong close in the direction of the prior trend suggests the doji was a pause; a strong close against the trend suggests the doji was a reversal. The confirmation is the signal; the doji is the setup.
The Doji in Candlestick Theory
In classical candlestick theory, the doji is a warning, not a signal. It tells the trader to pay attention, not to act. The warning is that the balance of buyers and sellers has become uncertain, and the uncertainty is a precondition for a change in trend.
What the Doji Does Not Do
It does not predict the direction of the next move. It does not identify tops and bottoms. It describes a session where the open and close were approximately equal, and it makes that description visible. Used as a warning of indecision, it is useful. Used as a standalone reversal signal, it will produce more false positives than true ones.
Risk Disclosure: The above content is a discussion of technical analysis methods only and does not constitute any investment advice. Candlestick patterns carry no predictive guarantee; no single pattern should be the sole basis for trading decisions. Markets carry risk; decisions must be independent.