Candlestick Patterns
Hammer and Shooting Star: Failed Attempts
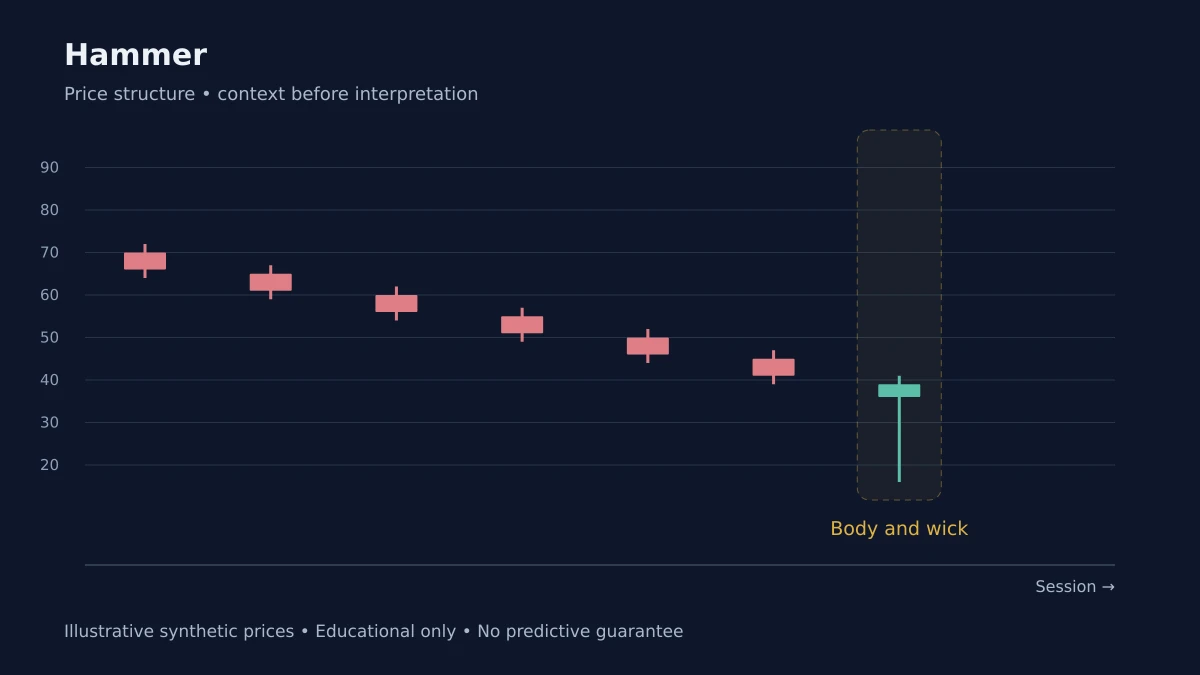
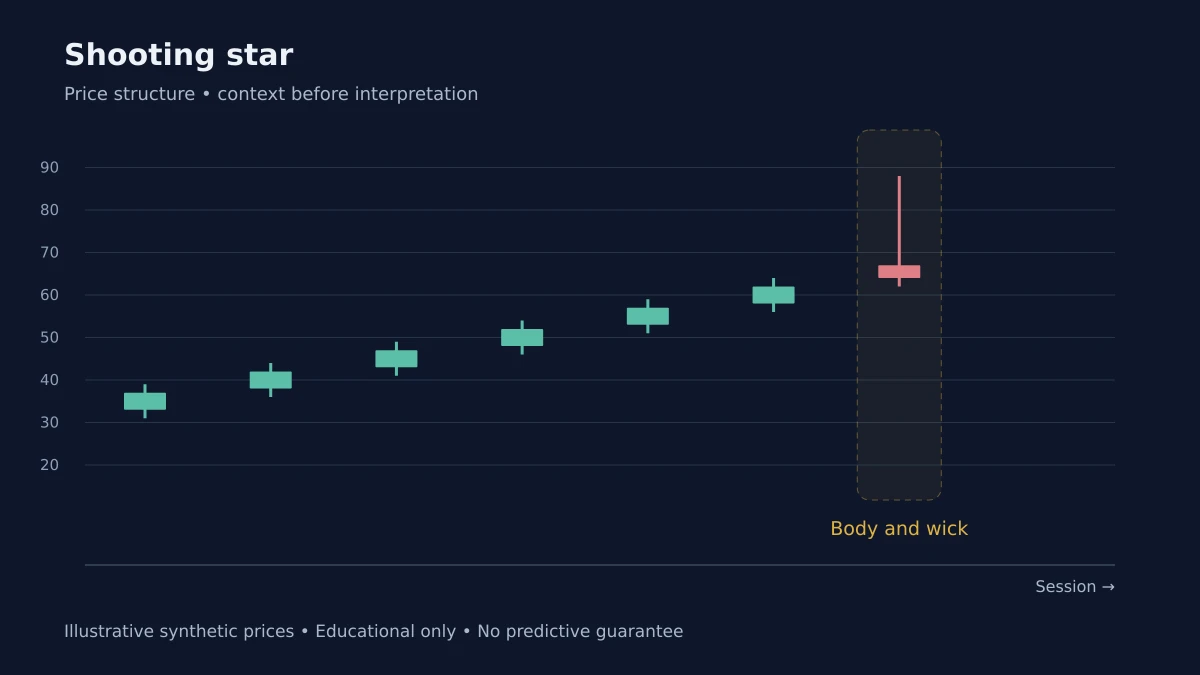
The hammer and the shooting star are mirror images, and both are built around a long wick. The hammer has a long lower wick and a small body at the top of the range; it describes a session that sold off and recovered. The shooting star has a long upper wick and a small body at the bottom of the range; it describes a session that rallied and faded.
Both patterns describe a failed attempt. The hammer describes a failed attempt to push price lower; the shooting star describes a failed attempt to push price higher. The failure is the signal, and the context is what gives the failure meaning.
The Hammer
The hammer is a bullish pattern, typically appearing at the bottom of a downtrend. The long lower wick describes a session where sellers pushed price down, but buyers stepped in and pushed it back to near the open. The recovery is the signal: the sellers tried and failed.
The hammer is more meaningful when it appears after a decline, ideally at a support level. A hammer in the middle of a range is less informative, because the failed attempt is less significant in context.
The Shooting Star
The shooting star is a bearish pattern, typically appearing at the top of an uptrend. The long upper wick describes a session where buyers pushed price up, but sellers stepped in and pushed it back. The failure is the signal: the buyers tried and failed.
The shooting star is more meaningful when it appears after an advance, ideally at a resistance level.
The Body and the Wick
The relative sizes of the body and the wick matter. A small body with a long wick is a more meaningful pattern than a larger body with a shorter wick, because the small body indicates that the open and close were close together, and the long wick indicates the failed attempt was substantial.
The color of the body is less important than the position of the body within the range. A hammer with a green body is slightly more bullish than one with a red body, but the difference is minor compared to the position of the body.
The Confirmation
Neither pattern is a signal on its own. The confirmation comes from the following candle: a strong close in the direction of the pattern suggests the failure was genuine; a strong close against it suggests the pattern was a pause. The confirmation is the signal.
What These Patterns Do Not Do
They do not predict the direction of the next move with certainty. They describe a failed attempt, and they make the failure visible. Used with context and confirmation, they are useful. Used as standalone reversal signals, they will produce more false positives than true ones.
Risk Disclosure: The above content is a discussion of technical analysis methods only and does not constitute any investment advice. Candlestick patterns carry no predictive guarantee; no single pattern should be the sole basis for trading decisions. Markets carry risk; decisions must be independent.