Technical Analysis
Island Reversal: A Cluster Isolated by Gaps
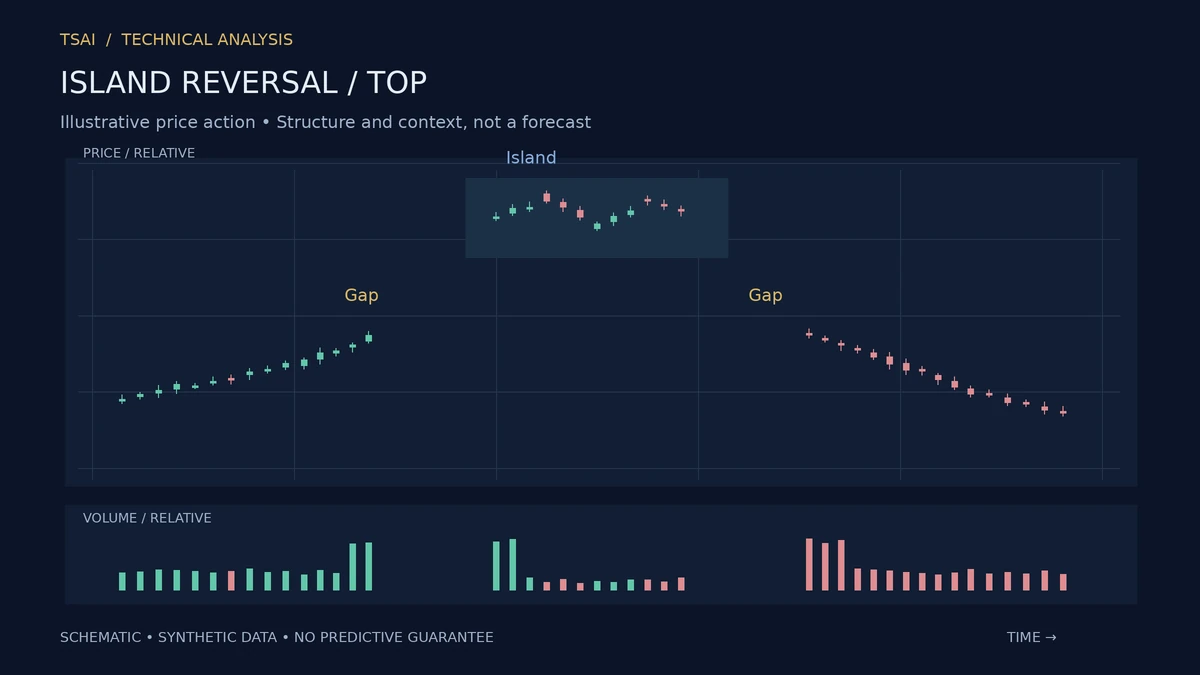
An island reversal is a chart pattern in which a cluster of price action is isolated by gaps on both sides. The cluster can be a single period or several, and it forms an "island" separated from the surrounding price action. The pattern is often a reversal signal, because the gaps on both sides describe a sharp change in sentiment.
The pattern is relatively rare, which makes it more significant when it appears. The gaps are the key feature: they describe discontinuities in the price series that are consistent with a sudden shift in the balance of buyers and sellers.
The Structure
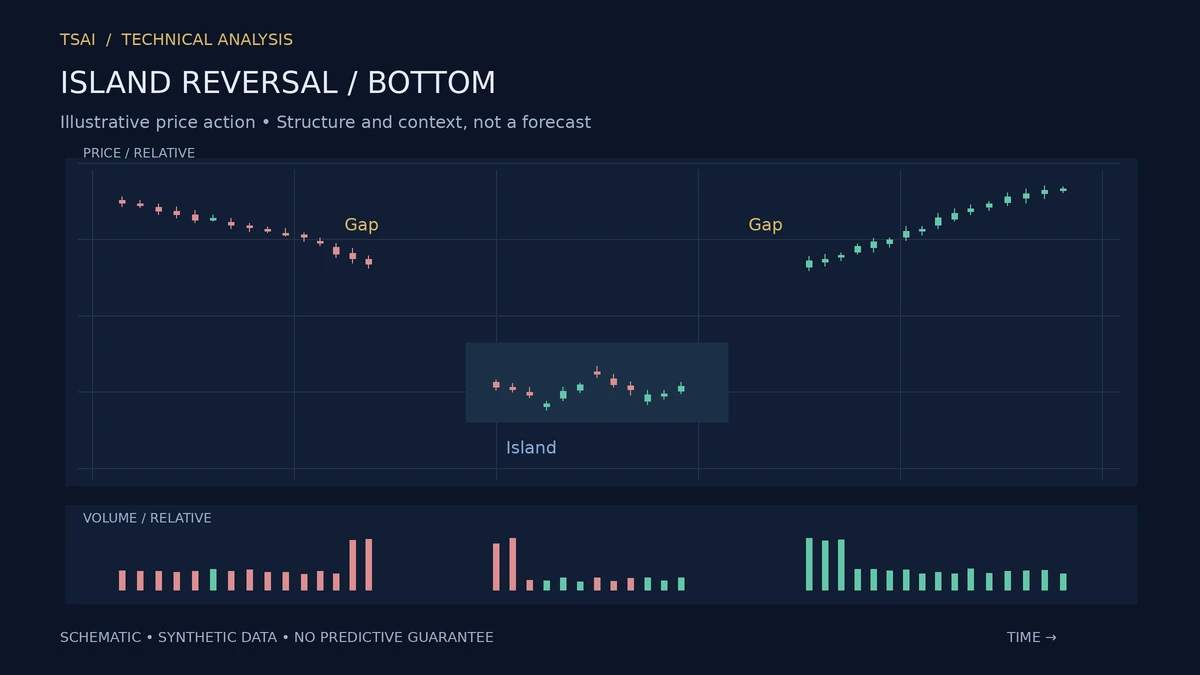
An island reversal top consists of a gap up into the island, a cluster of price action at the elevated level, and a gap down out of the island. The gaps can be in either direction, depending on whether the pattern is a top or a bottom. The island itself is the cluster between the gaps.
The pattern is more reliable when the gaps are large and the island is small. A large gap describes a more significant discontinuity; a small island describes a more concentrated change in sentiment.
The Volume Signature
The volume signature of an island reversal is typically high on the gaps and lower on the island itself. The high volume on the gaps is consistent with the discontinuity: the market is repricing sharply. The lower volume on the island is consistent with the consolidation.
The Target
The conventional target for an island reversal is the size of the island, projected from the second gap. The target is a convention, not a prediction.
The Failure Mode
The most common failure mode is a pattern that looks like an island reversal but is actually a gap that gets filled. The distinction is the second gap: without it, the cluster is not isolated, and the pattern is not an island reversal.
What the Pattern Does Not Do
It does not predict the size or timing of the reversal. It does not work because of any rule about gaps. It describes a cluster of price action isolated by discontinuities, and it makes the structure visible. Used as a reversal signal, it is one of the more reliable classical patterns. Used as a guarantee, it will fail often enough to be costly.
Risk Disclosure: The above content is a discussion of technical analysis methods only and does not constitute any investment advice. Chart patterns carry no predictive guarantee; no single pattern should be the sole basis for trading decisions. Markets carry risk; decisions must be independent.